Assessing
Water Resource Vulnerability to Climate Change in Al-karak, Jordan
Based on GIS and Remote Sensing
AlShamaen, F.,1 Wan Ibrahim, W. M. M.2 and Leong, T. M.3
GeoInformatic Unit, Geography Section, School of Humanities, Universiti
Sains Malaysia, 11800 USM, Penang, Malaysia

*Corresponding Author
Abstract
Climate change and population growth exacerbate water scarcity in
Jordan, highlighting the imperative for vulnerability assessments;
however, the absence of a comprehensive framework with sufficient
indicators hinders effective evaluation of water resource
vulnerability. This research aims to determine spatial factors that
can contribute to the vulnerability of water resources in the study
area. Using the IPCC methodology, vulnerability is divided into
three distinct components: exposure, sensitivity, and adaptive
capacity. The study period spans from 1987 to 2022 (35 years). By
employing remote sensing (RS), GIS techniques, and the analytical
hierarchy process (AHP), fourteen indications were chosen based on
their proximity to the measured component. The indicators were then
normalized to produce a consistent scale ranging from 0 to 1. The
study employs a geometric aggregation methodology to evaluate water
resource vulnerability by integrating various indicators. The
composite indicator (CI) is calculated by geometrically aggregating
the vulnerability index (VI) of three components. This approach
captures complex relationships and synergies among indicators,
providing a comprehensive assessment of water resource
vulnerability. The vulnerability map produced from the study
illustrated vulnerability distribution throughout the area,
highlighting notable high-vulnerability zones such as the
AlQatraneh District, as well as portions of the northern and
southern regions, including the Alghour District, characterized by
arid conditions. Vulnerability values ranged from 0.44 to 0.5, with
a notable concentration around 0.4, indicating substantial
vulnerability. The study found a significant vulnerability in areas
with a consistent decline in annual rainfall of 1.3 mm / year and a
rise in annual variability of 2-3%. High-vulnerability areas
experienced a significant increase in rainfall variability and
temperature by 0.03°C /year, indicating continuous climate change.
Piezometric data validated the vulnerability index map, with a Kappa
index of 0.6552, attributed to factors such as declining
precipitation, rising temperatures, and increased water demand due
to population growth.
Keywords: Climate Change, Geographical Information
System, Jordan, Vulnerability Assessments, Water Resource
1. Introduction
Climate change is anticipated to impact both the quantity and quality
of water resources in Jordan. International assessments, including
those conducted by the Intergovernmental Panel on Climate Change [1],
have highlighted that region with already limited water resources, such
as the Middle East and North Africa, are likely to experience
exacerbated water scarcity. Past regional and local studies have
observed a rise in mean temperatures, as well as an increase in the
intensity and frequency of extreme temperatures, based on analyses of
historical weather data. Climate change is anticipated to yield both
overarching and localized impacts on the Earth's surface, including a
reduction in freshwater reservoirs alongside heightened water demand
[2]. The management of water resources has emerged as a paramount
concern in this context. Jordan is heavily reliant on rainfall, and the
prospects for water availability are not promising. The ensuing
imbalance between availability and demand for water is likely to expand
considerably as the climate changes. The Alkarak area is a semi-arid
ecosystem that is known to be extremely vulnerable to climate change,
with limited water resources primarily reliant on groundwater. However,
climate change can alter the hydrological cycle's fundamental drivers.
Climate change-induced longer droughts and rising temperatures have
hastened the depletion of Jordan's groundwater resources.
Over-extraction of groundwater for agricultural, industrial, and
domestic reasons has caused a fall in water tables and increasing
salinity levels [3]. In the context of water resources, vulnerability
assessment typically involves evaluating the susceptibility of water
systems to changes in precipitation patterns, temperature, evaporation
rates, extreme weather events, sea-level rise, and other climate-related
factors. This assessment may also consider the socio-economic factors
that influence access to water, water demand, and the capacity to adapt
to changing conditions [4]. There is a need to find a solution to
reduce the impact of climate change and its impact on all life forms in
the study area. To meet the growing demand on the agricultural,
drinking, household, and industrial sectors, and to address various
issues related to water resources management.
Several studies have conducted vulnerability assessments of water
resources using GIS, as demonstrated by research conducted by
[5][6][7][8] and [9]. However, despite these contributions, many
studies have primarily focused on hydrological and climatic factors in
vulnerability assessments, overlooking the significant role of
socio-economic factors such as poverty rate and water demand.
Integrating these socio-economic factors into vulnerability assessments
can provide a more comprehensive understanding of vulnerability and aid
in the development of effective adaptation strategies. On the other
hand, vulnerability
assessments conducted by >Al-Karablieh and Salman
[10] and [11], predominantly concentrated on surface water resources,
neglecting the vulnerability of groundwater to climate change. This gap
in research overlooks crucial aspects such as changes in recharge
rates, water quality, and overall sustainability of groundwater
resources.
The current study aims to address this gap by focusing specifically on
spatial factors influencing the vulnerability of water resources within
the designated study area. The specific objectives are: (1) to identify
spatial elements that potentially impact the vulnerability of water
resources in the study area, (2) Validate the Water Resources
Vulnerability Index Map within the study area. This validation process
is crucial for ensuring the effectiveness of the index map in
accurately representing the vulnerability of water resources in the
study area. By integrating spatial analysis techniques and pertinent
data, this study seeks to provide valuable insights into understanding
and addressing the challenges posed by water resource vulnerability,
thus contributing to more informed decision-making and effective
resource management strategies.
2. Materials and Methods
2.1 Study Area
The Al Karak Governorate, situated in the southern region of Jordan,
spans approximately 3,495 square kilometers,
boasting diverse geographical features (Figure 1). Its coordinates
range between longitudes 35°19'30" and 36°13'51" and latitudes
30°47'26" and 31°27'45" [12]. Positioned 130 kilometers south of
Amman, the capital, the governorate's cities vary in elevation from
over 1000 meters above sea level in the South AlMazar Department to 330
meters below sea level at Ghor Al-Safi Department. Five morphoclimatic
areas emerge due to distinct landforms across the region, including
semi-arid and hyper-arid regions, mountainous areas, and low-lying
regions approximately 400 meters below sea level.
The Mediterranean climate dominates the mountainous highlands,
experiencing cold winters with rainfall between 200 to 400 mm and dry,
hot summers. Conversely, the Jordan Valley regions exhibit a
subtropical climate, characterized by even drier and hotter conditions
compared to central and northern valleys. Limited agricultural land is
available in the study area, primarily due to water scarcity and dam
regulations. The Mediterranean climate prevails throughout the study
area, featuring hot, dry summers and relatively mild winters, with
minimal rainfall mainly occurring in winter. Positioned between the
Mediterranean Sea and the Arabian Desert, the governorate experiences
diverse climatic influences. The geographic landscape, comprising
mountains, valleys, and limited water resources, significantly impacts
various facets of life, including land use, economic activities, and
societal dynamics. Understanding the geographical context is vital for
conducting vulnerability assessments of water resources concerning
climate change, utilizing GIS and remote sensing technologies. This
understanding elucidates specific challenges and opportunities
associated with water resource management and adaptation strategies
within the Al Karak Governorate.
2.2 Data Description
Several criteria were chosen for the vulnerability assessment of water
resources to climate change after a complete review of current
literature and discussion with experts in the field. Establishing a
model for evaluating water resources entails identifying relevant water
factors.
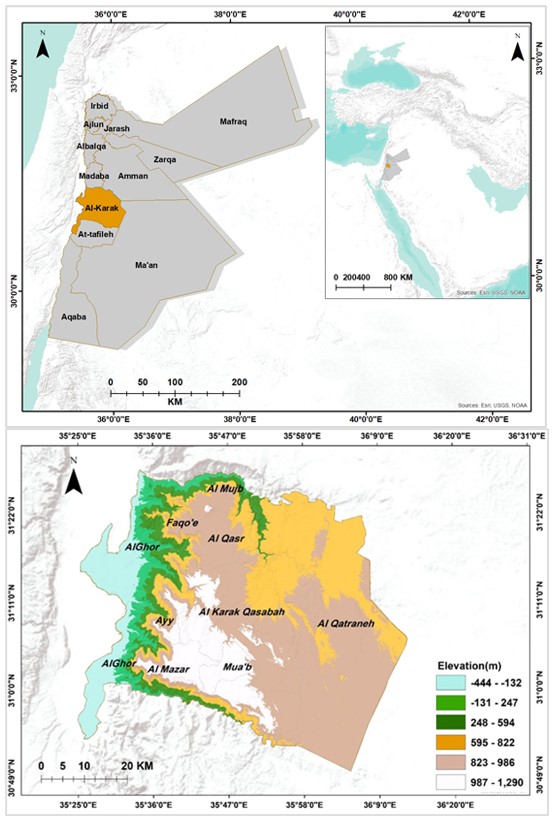
Figure 1: Al-karak, Jordan
In developing a model for assessing water resources, it is essential to
identify parameters relevant to water-related aspects. However, there
exists a lack of consensus regarding the specific criteria that should
be employed for this analysis [13] and [14]. In addition, it is
important to base the selection of criteria on the availability of
data. constructing a vulnerability assessment of water resources map
entails constructing a geographic database, integrating spatial data,
applying the AHP approach, verifying the model with historical water
resources data, and producing the final vulnerability index map, as
illustrated in Figure 2. The following section contains detailed
descriptions of these requirements.
Vulnerability assessment of water resources to climate change. Factors
and their relevance differ between studies, resulting in inconsistency
[15]. Researchers usually base their vulnerability assessments of water
resource challenges on the research area's unique physical and
ecological characteristics [16]. In the current study, a comprehensive
literature review was conducted to identify and choose 14 vulnerability
causative factors based on their relevance and significance, as
indicated in previous research. Furthermore, the availability of
geographic data is an important consideration when using factors or
variables. Table 1 displays the indicators used and the data source for
the vulnerability assessment of water resources.
2.3 Data Processing and Analysis
The indicators selected for the vulnerability assessment of water
resources to climate change in the study area. Selection of these
criteria was driven by their relevance to the assessment's objectives
and the reliability of the available datasets in Figure 2.
Table 1: Indicators of vulnerability assessment of
water resources
|
Component
|
Indicator
|
Code
|
Unit
|
Period
|
Data Source
|
|
Exposure
|
Precipitation(mm)
(annual/daily)
|
E1
|
mm
|
1987-2022
|
Ministry of Water and Irrigation
|
|
Temperature
(annual/daily)
|
E2
|
°C
|
1987-2022
|
Ministry of Water and Irrigation
|
|
Soil
|
E3
|
m
|
2022
|
Royal Jordanian Geographic center
|
|
Landcover
|
E4
|
km2
|
1987-2022
|
Satellite image from Landsat
|
|
Sensitivity
|
Groundwater recharge
|
S1
|
mm
|
2000-2020
|
Ministry of Water and Irrigation
|
|
Groundwater quality
|
S2
|
mm
|
2000-2020
|
Ministry of Water and Irrigation
|
|
Water demand
|
S3
|
mm
|
2000-2020
|
Ministry of Water and Irrigation
|
|
Topography
|
S4
|
km2
|
2022
|
Royal Jordanian Geographic Center
|
|
Poverty rate
|
S5
|
person
|
1999 -2022
|
Department of Statistics
|
|
Water consumption per capita
|
S6
|
m3 /capita/year
|
1999-2022
|
Ministry of Water and Irrigation
|
|
Population density
|
S7
|
people/km2
|
2000-2022
|
Department of Statistics
|
|
Adaptive Capacity
|
Rainwater harvesting
|
A1
|
mm
|
2000-2020
|
Ministry of Water and Irrigation
|
|
Wastewater treatment
|
A2
|
mm
|
2000-2020
|
Ministry of Water and Irrigation
|
|
Greywater reuse
|
A3
|
mm
|
2000-2020
|
Ministry of Water and Irrigation
|
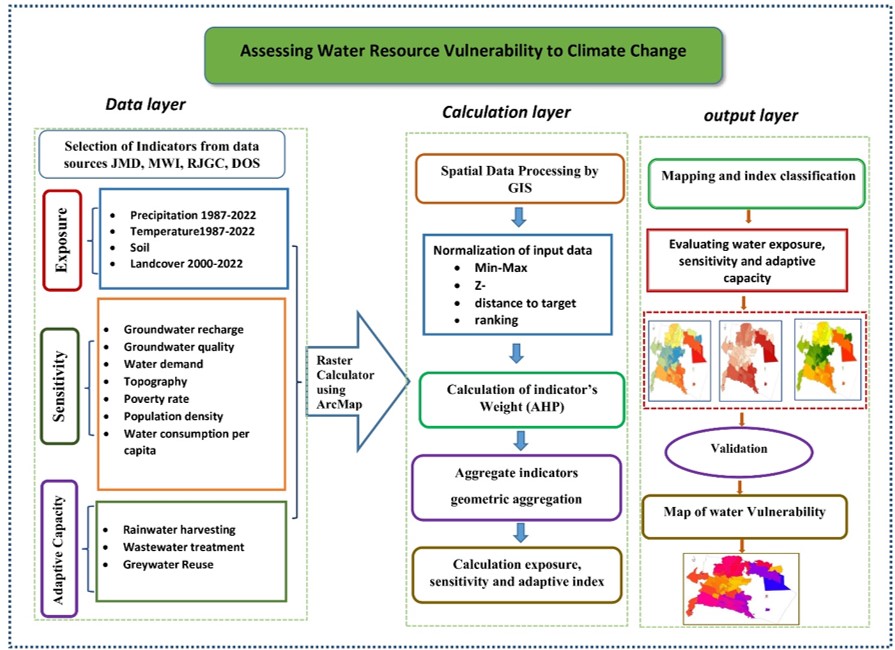
Figure 2: The framework of water vulnerability
assessment to climate change
The water resource vulnerability assessment framework comprises three
primary layers: the data layer, calculation layer, and output layer.
Input data from various sources such as satellite data, statistical
data, expert opinions and regional documents are collected for
variables. These data are stored in a database system, with statistical
data displayed in Microsoft Excel and spatial data processed by ArcGIS
10.8. The calculation layer involves five steps, including processing
satellite images, normalizing input data, calculating data weights, and
determining components and indicators following the vulnerability
assessment method. The output layer presents assessment results through
tables, maps, and graphs, integrating with Excel and ArcGIS 10.8. The
module demonstrates exposure, sensitivity, and adaptive indices for
provinces or ecological zones, as well as the water vulnerability index
(VI) for specific time periods. Maps illustrate results, aiding
policymakers and local authorities in identifying water vulnerability
levels for regions and implementing effective management strategies.
This approach was adopted to uphold result accuracy and safeguard the
integrity of the study area. The ArcGIS platform was employed to
reclassify and rank all selected criteria on a scale from 1 to 5,
representing very low to very high vulnerability assessments of water
resources. Cell sizes were established at a minimum of 30 m × 30 m to
capture detailed ground-level information effectively. Figures 3, 4 and
5 depict all the layers created in this process. Specific details
regarding each layer are elaborated upon in the subsequent subsections
Figure 2. The framework of water vulnerability assessment to climate
change.
2.3.1 Rainfall CV
Climate change influences precipitation patterns, impacting both the
average and variability of precipitation [17]. Researchers employ the
coefficient of variation (CV) to evaluate how climate change affects
precipitation variability and its implications for water resources. The
CV, calculated as the standard deviation divided by the mean,
quantifies the variability of rainfall data. Using data from 11
rainfall monitoring stations spanning from 1987 to 2022, researchers
generated annual rainfall CV distribution maps via inverse distance
weighted (IDW) interpolation in ArcGIS 10.8. IDW, a robust
interpolation technique, predicts values at unknown locations based on
known ones. The study reveals significant rainfall variability in the
western area (CV > 40.0), with moderate variability in the middle
(CV around 30.0). Overall, the basin experiences substantial relative
rainfall variability, highlighting the impact of climate change on
precipitation pattern in Figure 3(a).
2.3.2 Temperature
Temperature is an important element in hydrological processes and water
supply. Integrating temperature indicators into vulnerability
assessments allows researchers to better grasp the complex interactions
between temperature-driven changes and other variables, resulting in a
more complete knowledge of water resource vulnerability [8] and [15].
Temperature data for four meteorological stations: using data from 1987
to 2022. The study area annual mean temperature was divided into five
classes. (18.5-19), (5 19.6-21), (0 21.1-22.4), (22.5-23.6) and
(23.7-25.5). The distribution of annual temperatures was generated
utilizing the inverse distance weighted (IDW) interpolation technique
within the ArcGIS 10.8 software platform as shown in Figure 3(b).
2.3.3 Soil type
Soil is the top layer of the earth's crust that develops slowly due to
the weathering process[18].
Depending on the soil texture. Alkarak soil texture can be separated
into five soil groups, as indicated in Figure 3(c) illustrates the
spatial distribution of soil texture classes at Alkarak. using ArcMap
to convert the shapefile representing Soil Type into a raster format,
use the Feature to Raster tool in ArcMap. The spatial distribution of
soil texture classes helps identify areas that are more susceptible to
erosion, as different soil textures have varying levels of stability.
2.3.4 Landcover
The use of landcover and indicators in the study of Vulnerability
Assessment of Water Resources to Climate Change, it helps in
identifying vulnerable areas, understanding the impacts of land use
changes on water resources [18]. The landcover maps were generated
using Landsat 5 and Landsat 8 imagery acquired from the USGS Earth
Explorer. The selection of the years, specifically 1987 and 2022, was
based on the availability of cloud-free data for the study areas. The
satellite imagery bands were processed by combining, re-projecting, and
clipping using layer stacking techniques. The supervised classification
method was then applied to extract land cover features from the
processed imagery. Change detection maps were created and analyzed
using ArcGIS software, by using the Image Analysis and Spatial Analyst
toolboxes utilizing the Image Analysis and Spatial Analyst toolboxes.
This approach provided valuable insights into the changes and trends in
landcover over the study period as shown in Figure 3(d).
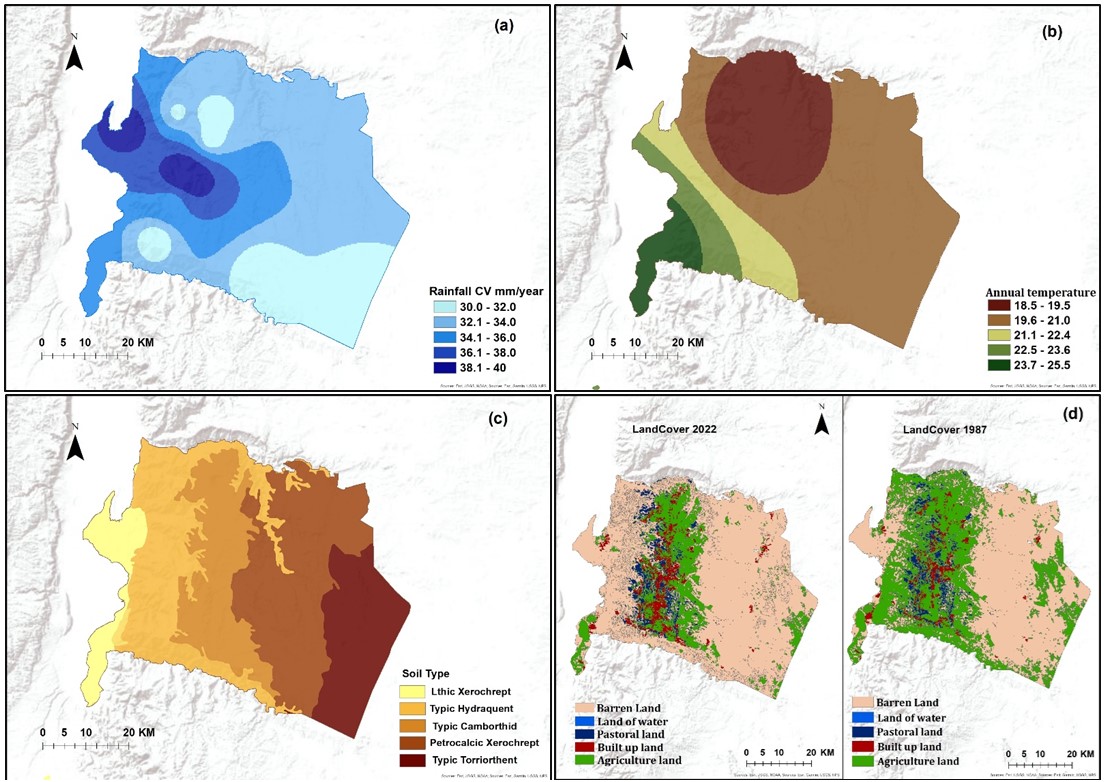
Figure 3: Exposure indicators:
(a) Coefficient variation rainfall from 1987 to 2022 (b) Annual
temperature from 1987–2022.
(c) Distribution of soil texture (d) Change in the types of land cover
between 1987 and 2022
2.3.5 Groundwater recharge
Groundwater, a crucial natural resource globally, undergoes recharge, a
pivotal aspect of water resource management, influenced by
precipitation, terrain, and soil cover [19].
Monitoring groundwater levels through observation wells and employing
the J2000 water balance model, based on a water budget approach, allows
for the estimation of recharge rates. Recharge
rates(D) (mm/year) are calculated using Equation 1.
D = P- ET – ΔS - Roff
Equation 1
Where P is precipitation, ET is evapotranspiration,
ΔS is change in soil water storage, and Roff is
runoff. Figure 4(a) illustrates groundwater recharge volumes from 1987
to 2022 in the study area, averaging
39.9 million cubic meters per year (MCM/year). The area is
classified into five categories, exhibiting recharge rates ranging from
less than 20 MCM to 49 MCM. Utilizing inverse distance weighted (IDW)
interpolation within ArcGIS, groundwater recharge data was generated to
provide spatial insights into recharge dynamics across the study area.
2.3.6 Groundwater quality
Groundwater quantity and quality vary due to natural and human-induced
factors like climate, hydrogeology, management practices, and
pollution. Increased water demand often leads to groundwater depletion
[20]. Evaluating groundwater quality involves tools like the Water
Quality Index (WQI), which combines multiple parameters into a single
value. Parameters like Langelier Saturation Index (LSI), Ryznar
Stability Index (RSI), Aggressiveness Index (AI), and Permeability
Index (PI) contribute to the WQI score. WQI categorizes water quality
into classes based on thresholds: Excellent (WQI < 50), Good (50 ≤
WQI ≤ 100), Poor (100.1 ≤ WQI ≤ 200), Very Poor (200.1 ≤ WQI ≤ 300), and
Unsuitable for Drinking (WQI > 300). Creating groundwater quality
maps involves using the IDW interpolation technique within ArcGIS
software as shown in Figure 4(b).
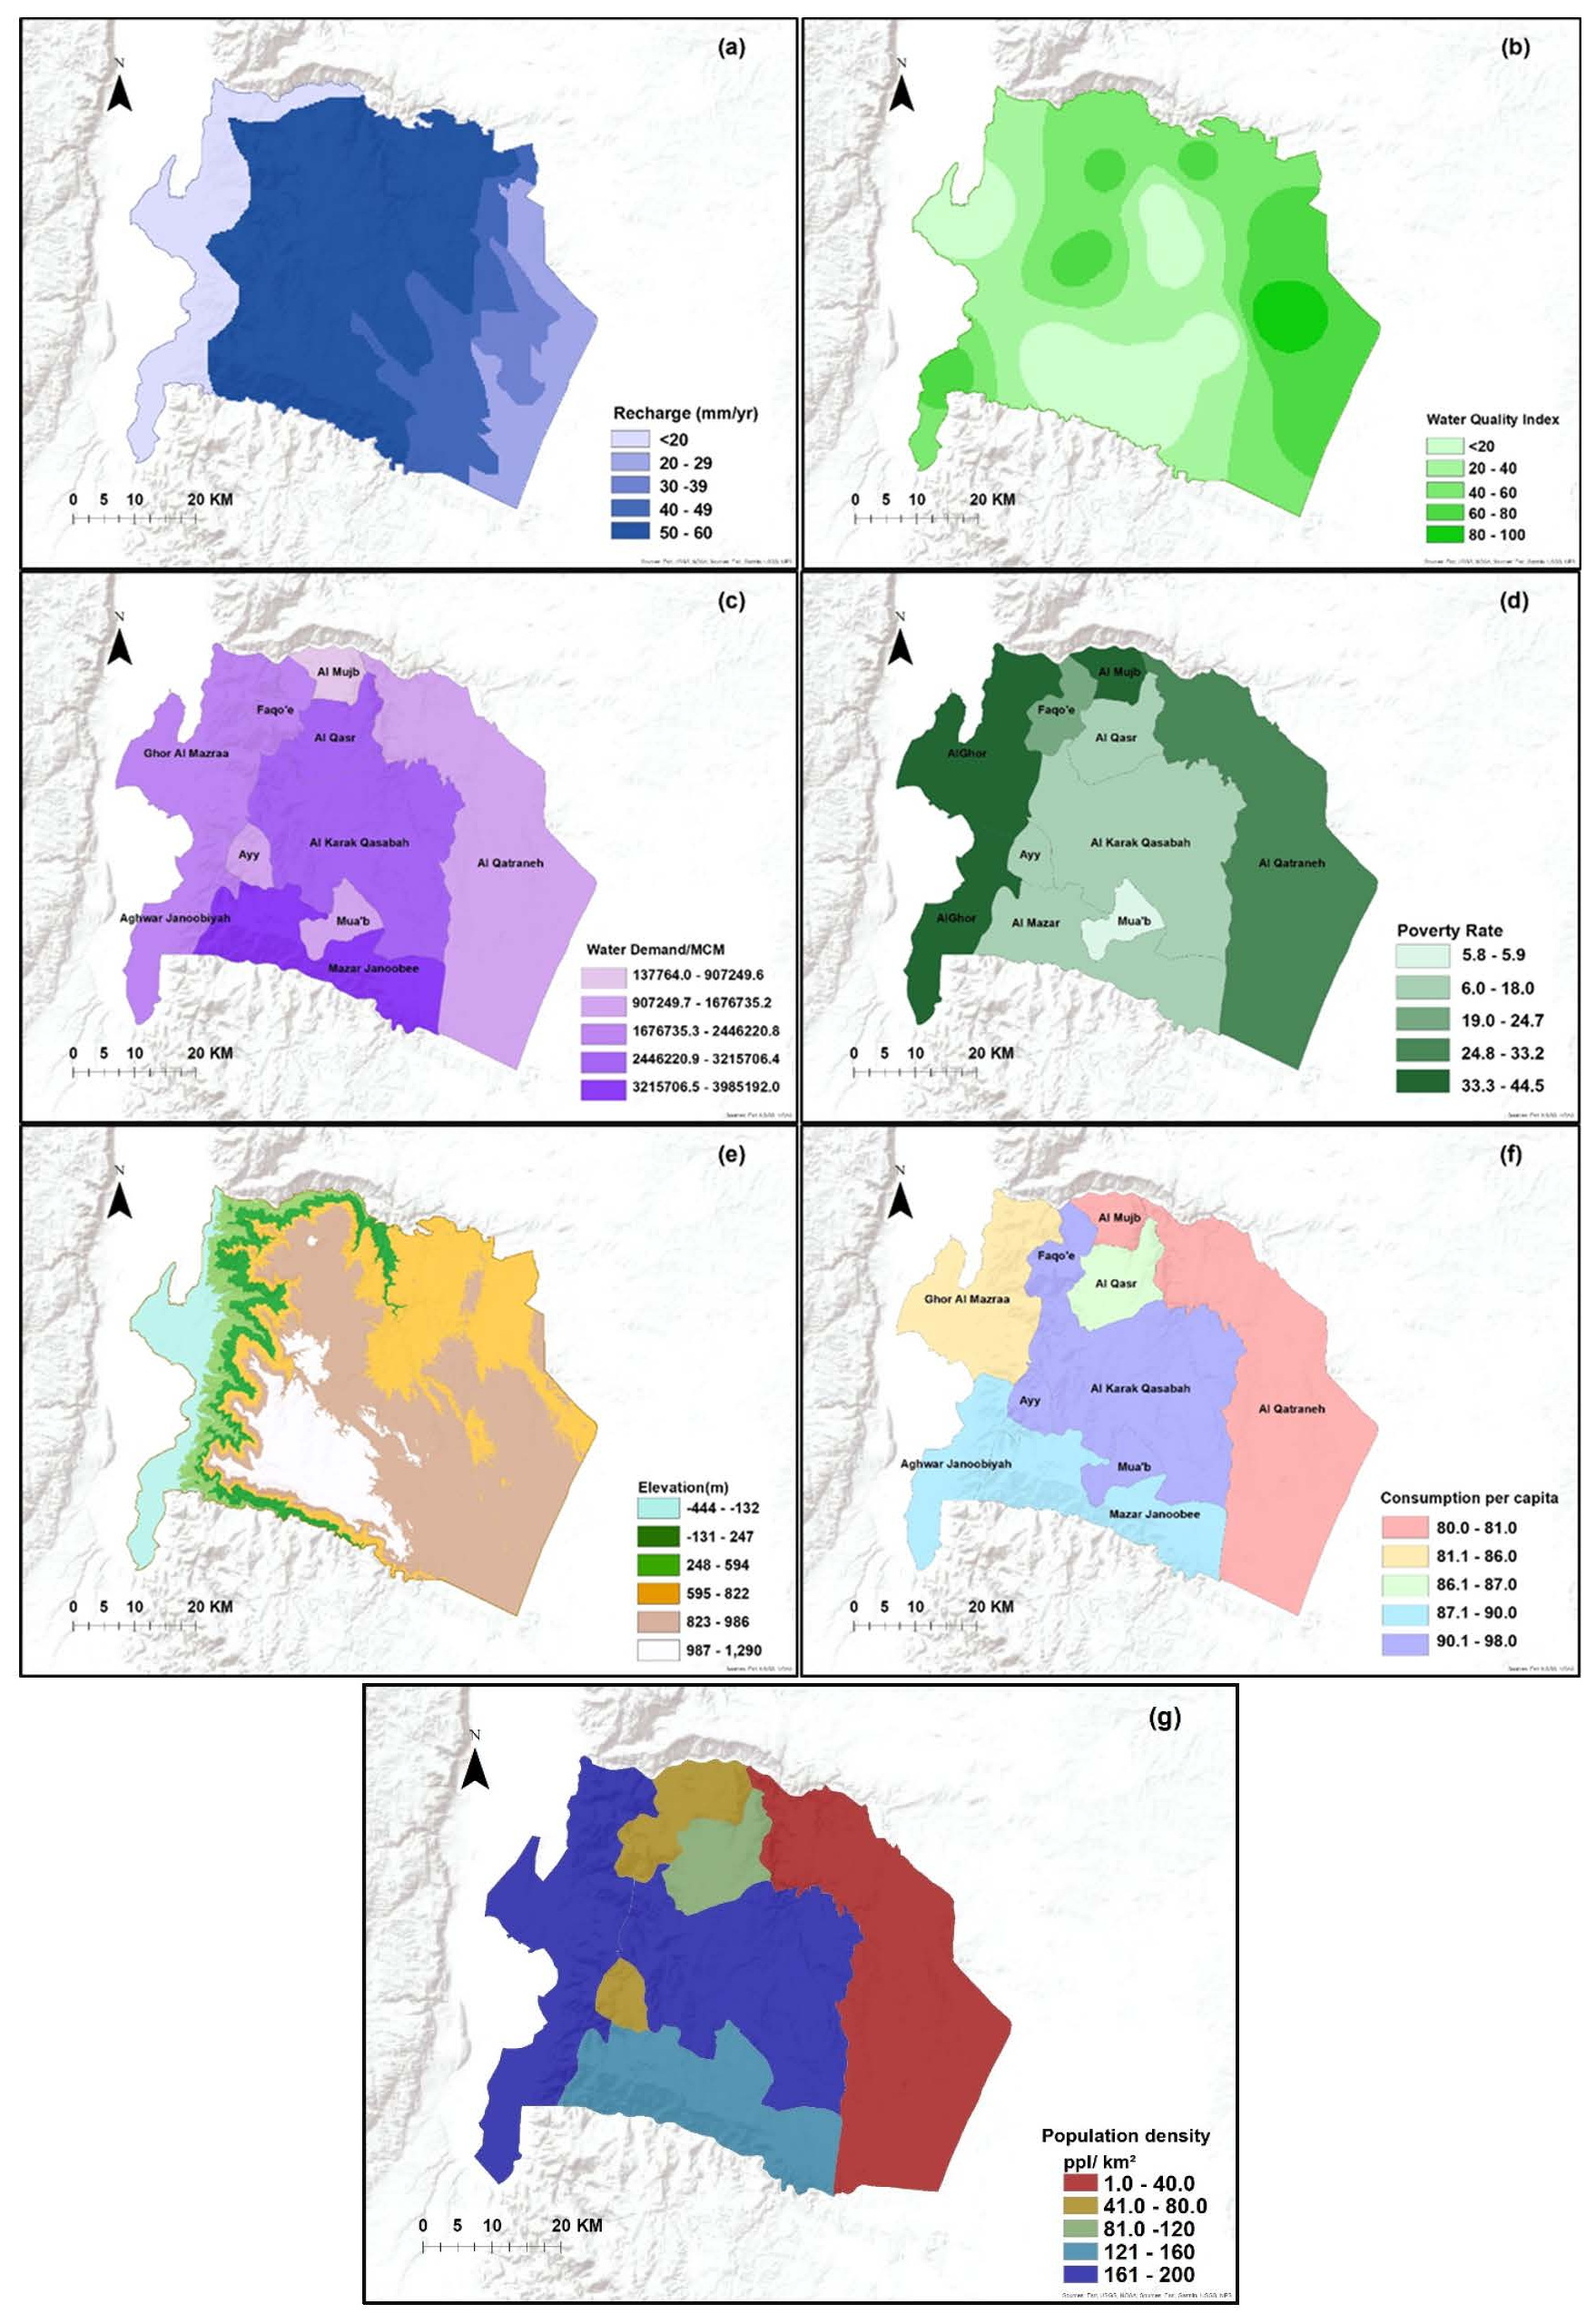
Figure 4: Sensitivity indicators:
(a) Groundwater recharge (b) Groundwater quality (c) Demand water (d)
Poverty rate
(e) Topography (f) Water consumption per capital (g) Population density
2.3.7 Water demand
The Water Demand
Indicator, which integrates demographic, socioeconomic, bulk demand, and
climatic aspects to explain water demand patterns, is discussed by [21]. The
rise in water demand, juxtaposed with diminishing availability,
underscores challenges in water management, leading to scarcity and
sustainability concerns. Municipal water supply in Jordan has steadily
increased from 9,244,742 to 12,633,789 million cubic meters (MCM)
between 2011 and 2023, with per capita daily consumption rising from
144 to 150 liters. Agriculture is the primary water consumer, followed
by municipal and industrial sectors. The study area was classified into
five consumption classes, ranging from 5.5-6 to 7.6-8 MCM per year, and
water demand data were illustrated within district boundaries (Figure
4(c)).
2.3.8 Topography (m)
Topography significantly influences local climate patterns,
particularly precipitation [22] and groundwater recharge, with flat or
gently sloping regions favoring increased infiltration [23]. Using a
10m resolution DEM, this study characterizes the varied topography of
Karak governorate, ranging from -400 meters below sea level along the
Dead Sea coasts to 1321 meters above surface level in AlMazar's
highlands. The study divides the region into five elevation classes,
illustrating the topographic diversity in Figure 4(d).
2.3.9 Poverty rate
The poverty rate, indicating the proportion of individuals living below
the poverty line, serves as a crucial metric for assessing
socio-economic well-being and inequality within a population [24]. Data
on poverty rates for the study area were sourced from the Department of
Statistics in 2023. The poverty rate ranges in Alkarak from 18.1% to
5.9%, as depicted in Figure 4(e).
2.3.10 Water consumption per capita
Water consumption per capita, the average water usage per individual
over a specified period and geographical area, is calculated by
dividing total water consumption by the population [25]. Jordan,
ranking second globally with minimal water resources, faces severe
scarcity, with yearly renewable water resources below 100m³ per person
[26]. The Ministry of Water and Irrigation underscores water's critical
significance as demand exceeds supply, with each individual allocated
just over 90 cubic meters annually,
projected to decrease further to as low as
60 cubic meters by 2040, as illustrated in Figure 4(f).
2.3.11 Population density
Population density significantly influences water resources and
management, impacting both supply and quality [27]. It correlates with
increased water consumption, stress on supply, and heightened
vulnerability to climate change [28] and [5]. This study reveals
district population densities ranging from 10.3 to 192.9 people per
km², with Al-Mazar district in southern Alkarak exhibiting the highest
density, as depicted in Figure 4(g).
2.3.12 Treated wastewater
The presence of three wastewater treatment plants (WWTPs) in urban
centers, treating over 3392 MCM, of wastewater annually, as per [29],
reflects Jordan's commitment to sustainable water management [30].
Strategic WWTP placement enables efficient wastewater reuse for
irrigation, fostering agricultural development while conserving
freshwater resources. The creation of a Treated Wastewater distribution
map using IDW interpolation in ArcGIS 10.8 reveals five classes ranging
from 712 MCM to 1369 MCM, as depicted in Figure 5(a).
2.3.13 Rainwater harvesting
Rainwater harvesting, increasingly adopted in water-scarce regions like
semi-arid areas, enhances water accessibility and meets household and
agricultural needs effectively [31]. The Jordan Valley Authority has
implemented numerous rainwaters harvesting projects, comprising 425
sites with a total designed storage capacity of 123.2 million cubic
meters, distributed across different governorates [5], as depicted in
Figure 5(b). Storage water in the study area ranged from 0.13 MCM to
10.47 MCM by the end of 2022.
2.3.14 Greywater reuse
Greywater, a significant potential water source, contributes to
reducing freshwater consumption and enhancing sustainability [32],
particularly crucial in regions facing altered precipitation patterns
and increased drought occurrences [33]. A project implemented in Karak
from February 2004 to October 2007 involved installing 110 greywater
systems, meeting Jordanian and WHO standards for treated wastewater
usage [34]. These initiatives, divided into 'Phase I' and 'Phase II,'
were linked by common aims [34] and [35], with all treated greywater
utilized for irrigation (200-300 L/day). Data obtained from MWI was
integrated into ArcGIS within district boundaries, as depicted in Figure
5(c).
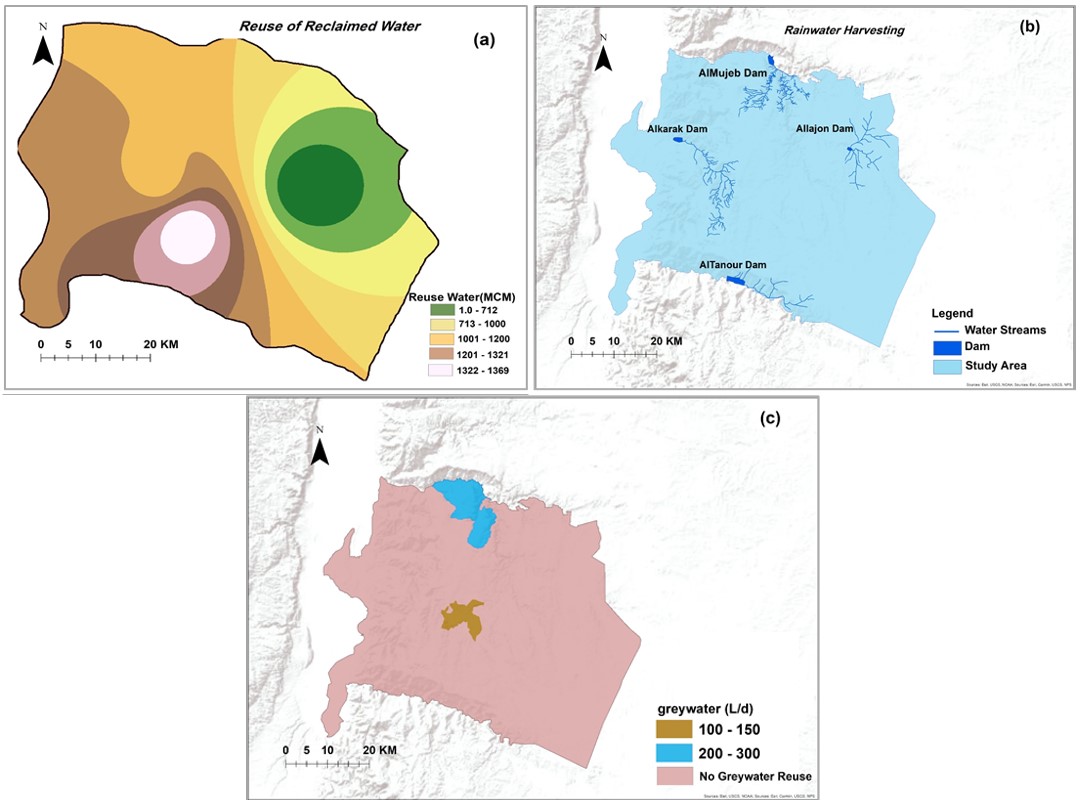
Figure 5: Adaptive capacity indicators: (a)Treated
wastewater (b) Rainwater harvesting(c) Greywater reuse
2.4 Indicator Weighting Using AHP
The Analytical Hierarchy Process (AHP), devised by [36], is a widely
utilized multi criteria decision-making method for prioritizing
indicators across diverse measurements, accommodating minor
contradictions in assessments [37]. Commonly applied in various
environmental studies, including vulnerability assessment of water
resources, AHP facilitates breaking down complex problems into smaller
components, utilizing expert judgment to determine relative priorities
within a hierarchy. In this study, 15 local specialists, including
water resource managers, hydrologists, climate change scientists, and
environmental engineers, were consulted to gather data and insights,
aiding in pairwise comparisons for generating a (14x14) matrix. This
matrix assigns relative weights to criteria, enabling informed
decision-making. Factors are ranked on a scale from 1 to 9, with 9
indicating the highest importance and 1 indicating the lowest. The
weight of each factor is determined, and the random consistency ratio
(CR) of the decision matrix is assessed using Equations (2) and (3).
The CR value less than 0.1 signifies an efficient judgment matrix. In
such cases, the maximum eigenvector is normalized to obtain the final
weight.

Equation 2
Where:
RI: random consistency index
CI: consistency index
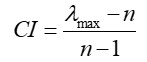
Equation 3
To proceed with the analysis , λ;max represents the
principal eigenvector computed using the eigenvector technique, and
n signifies the number of criteria.
2.5 Vulnerability Assessment
Several recent research [8][13] and [38], have taken a holistic
approach to water resources and suggested approaches for calculating a
vulnerability index (VI). The calculation of the Vulnerability Index,
which combines the Exposure Index, Sensitivity Index, and Adaptive
Capacity, is a critical step in assessing a system's or region's
overall vulnerability to climate-induced threats. Each component of
this composite index provides unique insights: Exposure identifies
potential threats, Sensitivity demonstrates the system's responsiveness,
and Adaptive Capacity evaluates its ability to cope and adjust. The
most common techniques in water resource risk assessment, especially in
a holistic approach, are factor selection, factor weighting, and data.
The most crucial step involves normalizing input datasets using
equation 4 that incorporates the UNDP's Human Development
Index (HDI) [40] and [40]. Every factor minimum value becomes 0,
its maximum value becomes 1, and every other value becomes a decimal
between 0 and 1.
Equation 4
Where, Xij represents the normalized score of the
j indicator for the ith area.
The guidelines for aggregating composite indices are extensively
outlined in the Handbook on the Construction of Composite Indices[41]. Geometric aggregation, involving the multiplication of normalized
weighted indicators, is selected to address concerns regarding
interaction and compensability [42], proving suitable for amalgamating
non-comparable data on a ratio scale, provided indicators remain
strictly positive [43]. The geometric mean, computed through a specific
formula, considers variations in achievement across dimensions, with
subpar performance in any dimension or indicator directly influencing
the composite indicator value. However, this technique exhibits partial
compensability, as it rewards composite indicators with higher scores
on individual indicators, as discussed by [44].
Aggregation of all relative vulnerabilities of each factor is achieved
using the "ArcGIS 10.8, Map Algebra, Raster Calculator" tool.
The subsequent formulas delineate the method for computing the
composite indicator (CIExposure) for various
components within the framework. The composite indicator is defined in
Equation 5.
CI Exposure = (EX1) w1 ·(EX2)
w2 ·(EX3) w3·… ·(EXn)
wn
Equation 5
Where EXi represents the normalized and assessed exposure
indicators, w signifies the weighing value
wi
, and n denotes the number of indicators. Sensitivity
component is defined in Equation 6.
CIsensitivity = (SE1) w1·(SE2)
w2·(SE3) w3 ·…· (SEn)
wn
Equation 6
Where SEisignifies the normalized and
evaluated sensitivity component, w denotes the weighing value
wi, and n represents the number of indicators.
Adaptive capacity components is defined in Equation 7.
CIACi = (AC1)w1·(AC2)w2·(AC3)w3·…·(ACn)wn
Equation 7
As a result, consolidating the last two factors, Potential Impact and
Adaptive Capacity, is imperative in deriving a comprehensive
vulnerability assessment. The appropriate approach for aggregating
these weighted components is expressed in Equation 8.
VI = (PIx)wPI·(ACx)wAC
Equation 8
Where PIx denotes Potential Impact and
ACx
signifies Adaptive Capacity. The corresponding weights are represented
by wPI and wAC, respectively.
2.6 Validation of Vulnerability Map
Validating a model that incorporates various dimensions such as
socio-economic, hydrological, potential sources of pollution, and
eco-environmental factors is challenging. Some researchers, like [45]
[46][47][48] and [49], who conducted integrated assessments of water
resource vulnerability, did not include validation modules for their
models. However, in
[50] authors employed a simulation-based integrated water resources
vulnerability assessment model and validated their findingsusing
observational data from four key factors. In contrast, researchers like
[51] and [52] used the DRASTIC method to evaluate water resource
vulnerability to
pollution, assuming that observing one or more physical and chemical
water parameters would validate the final vulnerability map.
To validate the final water resources vulnerability map in the study
area, data from 1987 to 2022 from 21 stations were utilized[53]. Piezometric data
in vulnerable areas was analyzed for validation purposes. Additionally,
water resources quality data from 40 monitoring sites, including 9
surface water stations and 31 groundwater stations spanning 30 years,
were examined. This data was categorized into five classifications:
extremely poor, poor, medium, good, and excellent. A confusion matrix
was created to compare these classifications with the categories of the
overall water resources vulnerability map. Finally, the Kappa index,
introduced by Cohen in 1960, was calculated to assess the agreement
between the water quality classifications and the vulnerability map
categories, providing a quantitative measure of validation.
3. Results and Discussion
3.1 Weights of Indicators using AHP
The weight of each index indicator/factor on the vulnerability of the
water resource system illustrates how these elements influence the
evaluation results. The Analytic Hierarchy Process computes each index
weight (Wi) (AHP). According to methodology, the weight indicators were
organized in a three-level hierarchy. The first phase is gathering the
experts' judgments, and the pair-wise comparison matrix and the final
factor weight of each criterion were obtained from the AHP approach as
shown in Table 2 and Table 3. After calculating the CI value (0.077)
and the supplied value RI (1.57) from Table Values for random index, the
consistency ratio CR is 0.047. The calculated value is less than the
maximum allowable value (0.1), based on that, the value is acceptable,
and the Analytical Hierarchy Process (AHP) indicates that the
consistency of all factors employed in this analysis is acceptable. The
weights assigned to each indicator in the vulnerability assessment are
illustrated in Table 4.
3.2 Reclassification of Indicators
The data layers were converted to raster format for consistent
evaluation and standardization, followed by reclassification into five
comparable classes. This study utilized a reclassification table
considering several factors affecting water resource vulnerability,
summarized in Table 5. Each thematic layer's classes were rated based
on their relative importance: very high (5), high (4), moderate (3), low
(2), and extremely low (1), integrating expert knowledge and analysis
for descriptive assessment.
Table 2: Pairwise comparison matrix
|
Criteria
|
A
|
B
|
C
|
D
|
E
|
F
|
G
|
H
|
I
|
J
|
K
|
L
|
M
|
N
|
|
A
|
1.00
|
2.00
|
2.00
|
2.00
|
5.00
|
3.00
|
2.00
|
2.00
|
3.00
|
5.00
|
9.00
|
5.00
|
4.00
|
3.00
|
|
B
|
0.50
|
1.00
|
2.00
|
2.00
|
6.00
|
3.00
|
2.00
|
2.00
|
3.00
|
2.00
|
9.00
|
5.00
|
4.00
|
3.00
|
|
C
|
0.50
|
0.50
|
1.00
|
0.50
|
5.00
|
2.00
|
1.00
|
0.50
|
2.00
|
5.00
|
7.00
|
4.00
|
3.00
|
2.00
|
|
D
|
0.50
|
0.50
|
2.00
|
1.00
|
6.00
|
3.00
|
2.00
|
2.00
|
3.00
|
6.00
|
9.00
|
5.00
|
4.00
|
3.00
|
|
E
|
0.20
|
0.17
|
0.20
|
0.17
|
1.00
|
0.25
|
0.20
|
0.20
|
0.25
|
0.50
|
3.00
|
0.50
|
0.33
|
0.25
|
|
F
|
0.33
|
0.33
|
0.50
|
0.33
|
4.00
|
1.00
|
0.50
|
0.50
|
2.00
|
4.00
|
6.00
|
3.00
|
2.00
|
2.00
|
|
G
|
0.50
|
0.50
|
1.00
|
0.50
|
5.00
|
2.00
|
1.00
|
0.50
|
2.00
|
5.00
|
7.00
|
4.00
|
3.00
|
2.00
|
|
H
|
0.50
|
0.50
|
2.00
|
0.50
|
5.00
|
2.00
|
2.00
|
1.00
|
2.00
|
5.00
|
8.00
|
4.00
|
3.00
|
3.00
|
|
I
|
0.33
|
0.33
|
0.50
|
0.33
|
4.00
|
0.50
|
0.50
|
0.50
|
1.00
|
4.00
|
2.00
|
3.00
|
2.00
|
2.00
|
|
J
|
0.20
|
0.50
|
0.20
|
0.17
|
2.00
|
0.25
|
0.20
|
0.20
|
0.25
|
1.00
|
3.00
|
0.50
|
0.33
|
0.33
|
|
K
|
0.11
|
0.11
|
0.14
|
0.11
|
0.33
|
0.17
|
0.14
|
0.13
|
0.50
|
0.33
|
1.00
|
0.25
|
0.20
|
0.17
|
|
L
|
0.20
|
0.20
|
0.25
|
0.20
|
2.00
|
0.33
|
0.25
|
0.25
|
0.33
|
2.00
|
4.00
|
1.00
|
0.50
|
0.33
|
|
M
|
0.25
|
0.25
|
0.33
|
0.25
|
3.00
|
0.50
|
0.33
|
0.33
|
0.50
|
3.00
|
5.00
|
2.00
|
1.00
|
0.50
|
|
N
|
0.33
|
0.33
|
0.50
|
0.33
|
4.00
|
0.50
|
0.50
|
0.33
|
0.50
|
3.00
|
6.00
|
3.00
|
2.00
|
1.00
|
|
SUM
|
5.46
|
7.23
|
12.63
|
8.39
|
52.33
|
18.50
|
12.63
|
10.44
|
20.33
|
45.83
|
79.00
|
40.25
|
29.37
|
22.58
|
Table 3: Normalized pairwise comparison matrix
|
Criteria
|
A
|
B
|
C
|
D
|
E
|
F
|
G
|
H
|
I
|
J
|
K
|
L
|
M
|
N
|
Weights
|
|
A
|
0.18
|
0.28
|
0.16
|
0.23
|
0.10
|
0.16
|
0.16
|
0.19
|
0.15
|
0.11
|
0.11
|
0.12
|
0.14
|
0.133
|
0.159
|
|
B
|
0.09
|
0.14
|
0.16
|
0.23
|
0.11
|
0.16
|
0.16
|
0.19
|
0.15
|
0.04
|
0.11
|
0.12
|
0.14
|
0.133
|
0.139
|
|
C
|
0.09
|
0.07
|
0.08
|
0.06
|
0.10
|
0.11
|
0.08
|
0.05
|
0.10
|
0.11
|
0.09
|
0.10
|
0.10
|
0.089
|
0.087
|
|
D
|
0.09
|
0.07
|
0.16
|
0.11
|
0.11
|
0.16
|
0.16
|
0.19
|
0.15
|
0.13
|
0.11
|
0.12
|
0.14
|
0.133
|
0.132
|
|
E
|
0.04
|
0.02
|
0.02
|
0.02
|
0.02
|
0.01
|
0.02
|
0.02
|
0.01
|
0.01
|
0.04
|
0.01
|
0.01
|
0.011
|
0.019
|
|
F
|
0.06
|
0.05
|
0.04
|
0.04
|
0.08
|
0.05
|
0.04
|
0.05
|
0.10
|
0.09
|
0.08
|
0.07
|
0.07
|
0.089
|
0.064
|
|
G
|
0.09
|
0.07
|
0.08
|
0.06
|
0.10
|
0.11
|
0.08
|
0.05
|
0.10
|
0.11
|
0.09
|
0.10
|
0.10
|
0.089
|
0.087
|
|
H
|
0.09
|
0.07
|
0.16
|
0.06
|
0.10
|
0.11
|
0.16
|
0.10
|
0.10
|
0.11
|
0.10
|
0.10
|
0.10
|
0.133
|
0.106
|
|
I
|
0.06
|
0.05
|
0.04
|
0.04
|
0.08
|
0.03
|
0.04
|
0.05
|
0.05
|
0.09
|
0.03
|
0.07
|
0.07
|
0.089
|
0.055
|
|
J
|
0.04
|
0.07
|
0.02
|
0.02
|
0.04
|
0.01
|
0.02
|
0.02
|
0.01
|
0.02
|
0.04
|
0.01
|
0.01
|
0.015
|
0.024
|
|
K
|
0.02
|
0.02
|
0.01
|
0.01
|
0.01
|
0.01
|
0.01
|
0.01
|
0.02
|
0.01
|
0.01
|
0.01
|
0.01
|
0.007
|
0.012
|
|
L
|
0.04
|
0.03
|
0.02
|
0.02
|
0.04
|
0.02
|
0.02
|
0.02
|
0.02
|
0.04
|
0.05
|
0.02
|
0.02
|
0.015
|
0.027
|
|
M
|
0.05
|
0.03
|
0.03
|
0.03
|
0.06
|
0.03
|
0.03
|
0.03
|
0.02
|
0.07
|
0.06
|
0.05
|
0.03
|
0.022
|
0.038
|
|
N
|
0.06
|
0.05
|
0.04
|
0.04
|
0.08
|
0.03
|
0.04
|
0.03
|
0.02
|
0.07
|
0.08
|
0.07
|
0.07
|
0.044
|
0.051
|
|
Column sum
|
1.00
|
1.00
|
1.00
|
1.00
|
1.00
|
1.00
|
1.00
|
1.00
|
1.00
|
1.00
|
1.00
|
1.00
|
1.00
|
1.000
|
1.000
|
Table 4: Results of the weight calculation
|
Criteria
|
Indicator Name
|
Weight
|
|
A
|
Rainfall CV
|
0.158
|
|
B
|
Temperature
|
0.139
|
|
C
|
Landcover
|
0.090
|
|
D
|
Population density
|
0.132
|
|
E
|
Soil
|
0.018
|
|
F
|
Groundwater recharge
|
0.064
|
|
G
|
Groundwater quality
|
0.087
|
|
H
|
Water demand
|
0.106
|
|
I
|
Topography
|
0.055
|
|
J
|
Poverty rate
|
0.024
|
|
K
|
Water consumption per capita
|
0.012
|
|
L
|
Rainwater harvesting
|
0.027
|
|
M
|
Greywater reuse
|
0.038
|
|
N
|
Wastewater treatment
|
0.051
|
Table 5: Reclassification of the criteria and their
rating
|
Criteria
|
|
|
Rating
|
|
|
1
|
2
|
3
|
4
|
5
|
|
Rainfall CV (mm/day)
|
30.0-32.0
|
32.1-34.0
|
34.1-36.0
|
36.1-38.0
|
36.1-38.0
|
|
Temperature
|
18.5-19.5
|
19.6-21.0
|
21.1-22.4
|
22.5-23.6
|
23.7-25.5
|
|
Soil type
|
Camborthid
|
Chromoxere
|
Xerochrept
|
Calciorthid
|
Hydraquent
|
|
Landcover
|
Barren land
|
Pastoral land
|
Land of water
|
Agriculture land
|
Built up land
|
|
Population density
(per km2)
|
1.0-40.0
|
41.0-80.0
|
81.0-120
|
121-160
|
161-200
|
|
Groundwater recharge
|
<20
|
20–29
|
30–39
|
40–49
|
50–60
|
|
Groundwater quality
|
> 300
|
200 – 30
|
100 – 200
|
50 – 100
|
<50
|
|
Water demand
|
7.6-8
|
7.1-7.5
|
6.6-7
|
6.1-6.5
|
5.5-6
|
|
Topography (m)
Poverty rate
|
938-1295
|
681-937
|
331-680
|
-86- -330
|
-400--85
|
|
Poverty rate
|
10>
|
10 -20
|
21-30
|
31-40
|
41-50
|
|
Water consumption per capita
|
80-90
|
91-100
|
101 -120
|
121 - 130
|
131-14
|
|
Treated wastewater
|
<1
|
1 -712
|
713-1321
|
1322-1369
|
-
|
|
Rainwater harvesting
|
0.100- 2.01
|
2.100-4.01
|
4.10-6.01
|
6.10-8.01
|
8.10-11
|
|
Greywater reuse
|
100-200
|
200 - 300
|
-
|
-
|
-
|
|
|
|
|
|
|
|
3.3 Exposure Index
Exposure indicators are measurements or variables used to estimate a
system's or population's exposure to climate change impacts [1]. The
exposure map in Figure 6 was developed to show which parts were highly
exposed to climate hazards.
According to the exposure map Al-Qatraneh district, Alghour, almujeb
district in north were highly exposed. The highest part exposed was
AlQatraneh with 65%. Regions with high decline and variability in
rainfall mainly contributed to high exposure.
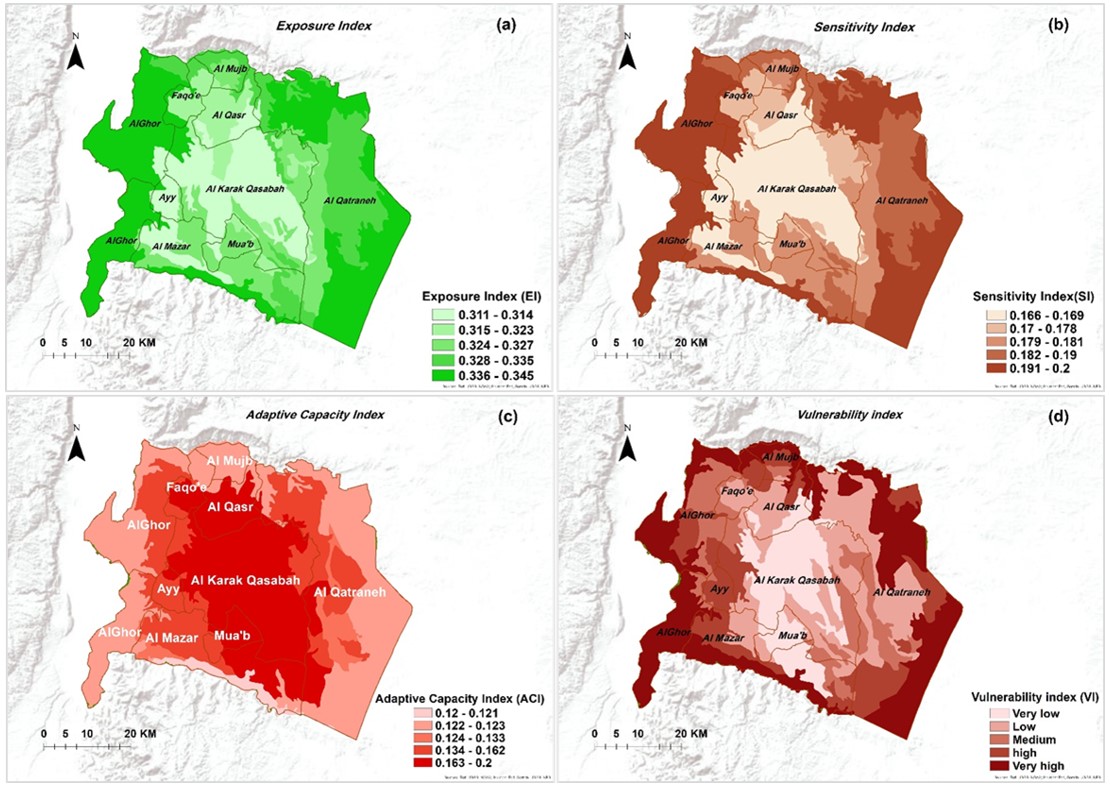
Figure 6: (a) Exposure index (b) Sensitivity index (c)
Adaptive capacity index (d) Vulnerability index
High temperature trends showed an increase in temperature that results
in increased evaporation rates leading to drying up, pasture and crops
causing increased drought situations decrease water resources. Overall,
the analysis conducted within the exposure component gives us a glimpse
of the climate dynamics that the community is exposed to over time,
and, thus, bringing the sensitivity and lack of adaptive capacity
allows us to analyze the vulnerability of the community within the
context of climate change.
3.4 Sensitivity
Index
The most sensitive areas were identified in Alkarak. All indicators
appeared to influence sensitivity in various locations to varying
degrees. AlQatraneh exhibited high sensitivity, reaching 70% as
depicted in Figure 6. This may be attributed to its elevated water
demand, with water consumption per capita falling below 90 m3
per person, and a relatively high poverty level in the AlQatraneh and
Alghour district. Groundwater recharge analysis indicated a decrease in
both level and quality.
3.5 Adaptive Capacity
In Al Karak, sites with a high adaptive capacity component were
identified. Various markers appear to have different effects on
adaptation across several sites. Water treatment, rainwater collecting,
and graywater treatment are all important practices for adjusting to
changing climates. Rainwater collection aids in groundwater recharging
and serves as an important supply of surface water. Wastewater
treatment also reduces agricultural water consumption and pollution.
The use of gray water in agricultural activities yields similar benefits
(Figure 6).
3.6 Vulnerability Index
The study involves conducting vulnerability assessments and proposing
methodologies to compute a Vulnerability Index (VI). The VI integrates
three key components: The Exposure Index, Sensitivity Index, and
Adaptive Capacity. These elements collectively assess the
susceptibility of a system or region to climate-induced risks. Each
component provides unique insights: Exposure identifies potential
hazards, Sensitivity reveals the system's responsiveness, and Adaptive
Capacity evaluates its ability to cope and adapt. Typical procedures in
water resource vulnerability assessment, especially within a holistic
framework, include selecting relevant factors, assigning weights to
these factors, standardizing data, and aggregating factors to form a
composite vulnerability index.
Table 6: Results of water resources vulnerability
assessment for the district zones
|
District Name
|
Vulnerability Index
|
Vulnerability Level
|
|
AlQasabeh
|
0.422
|
Very low
|
|
AlQatraneh
|
0.542
|
Very high
|
|
Almazar
|
0.456
|
Medium
|
|
Alqaser
|
0.445
|
Medium
|
|
AlGhour
|
0.515
|
High
|
|
Ayy
|
0.489
|
High
|
|
Faqo'e
|
0.446
|
Medium
|
|
Al Mujb
|
0.545
|
Very high
|
|
Mua'b
|
0.424
|
Low
|
Figure 6, depicts the spatial distribution of vulnerability within the
study area, highlighting notable high-exposure regions such as the
Alghour, AlQatraneh, and part at the northern and southern boundaries.
Vulnerability values ranged from 0.44 to 0.5, with a distinct
concentration around 0.4, indicating a significant level of
vulnerability. Indicators contributing to heightened vulnerability in
these regions include decreasing precipitation, rising temperatures,
increased water demand due to population growth, socio-economic
challenges indicated by the poverty index, and unique population
densities. Additionally, the limited implementation of effective
adaptation measures within the region further exacerbates vulnerability
levels.
Table 6 displays the vulnerability index and corresponding
vulnerability levels for various districts. Districts such as
AlQatraneh and Al Mujb exhibit very high vulnerability levels with
vulnerability indices of 0.54213 and 0.54512 respectively. AlGhour and
Ayy also demonstrate high vulnerability levels with indices of 0.5154
and 0.4895, respectively. Districts like Almazar and Faqo'e show medium
vulnerability levels, while AlQasabeh and Mua'b display lower
vulnerability levels categorized as extremely low and low, respectively.
The research findings confirm the objective of exploring the intricate
relationship between spatial variables and water resource vulnerability
in the study area. Analysis reveals that factors such as precipitation,
temperature, soil, land cover, population density, water demand,
groundwater recharge, topography, and groundwater quality significantly
contribute to observed vulnerabilities in water resources. These
spatial insights not only enhance comprehension of environmental
dynamics but also offer crucial data for formulating targeted
mitigation and management strategies. This research emphasizes the
importance of considering spatial factors when evaluating water
resource vulnerability, emphasizing their influence on current water
quality and availability.
The implications extend beyond the study, informing future research,
resource management practices, and policy development in similar
geographical contexts.
In semi-arid regions, the impacts of climate change, population growth,
and human activities exacerbate water resource vulnerabilities. Erratic
precipitation, prolonged droughts, and increased evaporation rates
intensify stress on water sources. Therefore, developing a
vulnerability index is crucial for identifying and prioritizing
high-risk areas, facilitating tailored and adaptive water resource
management strategies. A vulnerability index serves as a valuable
decision-support tool for policymakers, water resource managers, and
stakeholders involved in sustainable water management. By quantifying
water resource vulnerability, decision-makers can efficiently allocate
resources, implement mitigation measures, and plan for resilience,
thereby enhancing overall sustainability and resilience of the water
supply system.
3.7 Validation of Vulnerability Map
This study focusing on the vulnerability of water resources to climate
change, particularly related to groundwater quantity and quality in the
study area, the final water resource vulnerability index map was
validated using various data sources. Water resources quality data
spanning from 1987 to 2023 from 21 stations [54], were utilized for
validation purposes. Additionally, piezometric data from vulnerable
locations were analyzed.
Specifically, the validation process involved examining piezometric
data from different areas. In Alkarak AlQasabeh and Almazar district, a
significant decline in piezometric levels was observed from 1m in the
1970s to 5m in 2020. Similarly, in Almujeb, there was a notable
reduction in piezometric levels between 2006 and 2018, with the deepest
wells experiencing a decrease from 2.5 m to 6 m. AlQatraneh also
exhibited a definite drop in water level across several wells from 1996
to 2021, with the most substantial decrease recorded from 2 m to 10 m
deep.
Furthermore, AlQatraneh experienced multiple dry periods in recent
years, including one in August 2018. In Alghour, a considerable
reduction in piezometric level was noted from 1m in the 1980s to 11m in
2015. Similar to AlQatraneh, AlGhour also faced several dry spells,
with the most recent occurring between August 2013 and 2019
.
Long-term water quality data is critical for understanding water
quality dynamics and trends across time. This study conducted a
comprehensive analysis of 20 years of data obtained from 50 water
quality monitoring stations, including 9 surface water stations and 41
groundwater stations. The data were divided into five categories,
ranging from very bad to good quality. Furthermore, a confusion matrix
was created to investigate the association between these water quality
classes, and the vulnerability classes represented on the total water
resources vulnerability map, yielding a Kappa index of 0.6552. According to
Cohen's classification scheme, this index indicates a significant level
of agreement between the water quality classifications and the
vulnerability map classes.
4. Conclusions
Assessing water vulnerability accurately is crucial for understanding
the impacts of climate change and human activities on water resources,
particularly for informing future water management strategies. While
existing vulnerability assessment methods face challenges due to data
impracticality and availability, this study introduces a novel
framework integrating satellite imagery and GIS-based models. This
approach proves advantageous for its adaptability to the complex nature
of vulnerability assessment.
The research presents the first comprehensive vulnerability assessment
of water resources in Alkarak, focusing on key impact aspects such as
precipitation, temperature, population density, and topography. Results
indicate high vulnerability in AlGhour and AlQatraneh districts, with
land use/land cover emerging as the dominant parameter contributing 27%
to the vulnerability index. The study identifies indicators like
precipitation, temperature, population density, water demand, and
groundwater quality as significant contributors to water quantity
vulnerability.
The expanding population in Alkarak, coupled with increasing surface
infrastructures, exacerbates susceptibility to water quantity
vulnerability. Future research directions should explore scenarios such
as population growth, water availability, and climate change to refine
the framework's resolution in identifying vulnerable hotspots.
Challenges within the study area related to climate change, increasing
human pressure, unsustainable land use practices, and soil are
addressed through a GIS modeling approach. The study underscores the
role of vulnerability as a barrier to sustainable development,
emphasizing the need for mitigation strategies. Lastly, the model's
applicability in other semi-arid environments is highlighted,
suggesting broader relevance beyond the study area.
References
[1] Edenhofer, O., Pichs-Madruga, R., Sokona, Y., Farahani, E.,
Kadner, S., Seyboth, K., Adler, A., Baum, I., Brunner, S., Eickemeier,
P., Kriemann, B., Savolainen, J., Schlömer, S., von Stechow, C. and
Zwickel, T., (2014).
Intergovernmental Panel on Climate Change (IPCC) - Climate Change
2014: Mitigation of Climate Change
. Cambridge, UK: Cambridge University Press, 1-161.
https://www.ipcc.ch/site/assets/uploads/2018/03/WGIIIAR5_SPM_TS_Volume-3.pdf.
[2] Jibrin, A. and Suleiman, M. Y., (2022). Impact of Climate
Variability on Water Supply and Distribution in Chanchaga and Bosso
Local Government Areas, Niger State, Nigeria.
African Scholar Journal of Built Env. & Geological Research
(JBEGR-4)
, Vol. 27(4), 103-114.
[3] Gazal, O. M. D. N. M., (2021). Groundwater Deterioration in Arid
Agricultural Area Under the Pressure of Climate Change and High Refugee
Inflow. Case Study: Jordan.
International Journal of Hydrology Science and Technology
, Vol. 12(3), 253-315.
https://doi.org/10.1504/IJHST.2021.117547.
[4] Gumel, D. Y., (2022). Assessing Climate Change Vulnerability: A
Conceptual and Theoretical Review.
Journal of Sustainability and Environmental Management
, Vol. 1(1), 22-31.
https://doi.org/10.5281/zenodo.6206933.
[5] Koech, G., Makokha, G. O. and Mundia, C. N., (2020). Climate
Change Vulnerability Assessment Using a GIS Modelling Approach in ASAL
Ecosystem: A Case Study of Upper Ewaso Nyiro Basin, Kenya.
Modeling Earth Systems & Environment,
Vol. 6(1), 479–498.
https://doi.org/10.1007/s40808-019-00695-8.
[6] Qin, H., Cao, G., Kristensen, M., Refsgaard, J. C., Rasmussen,
M. O., He, X., Liu, J., Shu, Y. and Zheng, C., (2013). Integrated
Hydrological Modeling of the North China Plain and Implications for
Sustainable Water Management.
Hydrology and Earth System Sciences
, Vol. 17(10), 3759-3778.
https://doi.org/10.5194/hess-17-3759-2013.
[7] Al-Kalbani, M. S., Price, M. F., Abahussain, A., Ahmed, M. and
O’Higgins, T., (2014). Vulnerability Assessment of Environmental and
Climate Change Impacts on Water Resources in Al Jabal Al Akhdar,
Sultanate of Oman. Water, Vol. 6(10), 3118-3135.
https://doi.org/10.3390/w6103118.
[8] Kumne, W. and Samanta, S., (2023).
Geospatial Mapping of Inland Flood Susceptibility Based on
Multi-Criteria Analysis – A Case Study in the Final Flow of Busu River
Basin, Papua New Guinea.
International Journal of Geoinforma tics
, Vol. 19(6), 31–48.
https://doi.org/10.52939/ijg.v19i6.2693.
[9] Chhetri, R., Kumar, P., Pandey, V. P., Singh, R. and Pandey, S.,
(2020). Vulnerability Assessment of Water Resources in Hilly Region of
Nepal. Sustainable Water Resources Management, Vol. 6, 1-12.
https://doi.org/10.1007/s40899-020-00391-x.
[10] Tazi, M., El Azzab, D., El Moutaouakkil, N., and Charroud, M., (2024). Integration of
Geospatial Technologies and Fuzzy-AHP Analysis to Assess Groundwater
Potential in the Sirwa Massif, Anti-Atlas Region, Morocco.
International Journal of Geoinformatics
, Vol. 20(5), 79–94.
https://doi.org/10.52939/ijg.v20i5.3235.
[11] Khosravi, K., Panahi, M. and Tien Bui, D., (2018). Spatial
Prediction of Groundwater Spring Potential Mapping Based on an Adaptive
Neuro-Fuzzy Inference System and Metaheuristic Optimization.
Hydrology and Earth System Sciences
, Vol. 22(9), 4771-4792.
https://doi.org/10.5194/hess-22-4771-2018.
[12] Department of Statistics (DoS), (2022).
Jordan Statistical Yearbook
. Jordan: Department of Statistics (DoS).
http://dosweb.dos.gov.jo/products/statistical_yearbook2017.
[13] Nguyen, T. T., Ngo, H. H., Guo, W., Nguyen, H. Q., Luu, C., Dang,
K. B., Liu, Y. and Zhang, X., (2020). New Approach of Water Quantity
Vulnerability Assessment Using Satellite Images and GIS-based Model: An
Application to a Case Study in Vietnam.
Science of the Total Environment
, Vol. 737, 139784.
https://doi.org/10.1016/j.scitotenv.2020.139784.
[14] Mohd Rasu, M., Suhandri, H., Khalifa, N., Abdul Rasam, A., and
Hamid, A. (2023). Evaluation of Flood Risk Map Development through
GIS-Based Multi-Criteria Decision Analysis in Maran District, Pahang -
Malaysia. International Journal of Geoinformatics, Vol.
19(10), 1–16.
https://doi.org/10.52939/ijg.v19i9.2873.
[15] Anandhi, A. and Kannan, N., (2018). Vulnerability Assessment of
Water Resources–Translating a Theoretical Concept to an Operational
Framework Using Systems Thinking Approach in a Changing Climate: Case
Study in Ogallala Aquifer. Journal of Hydrology, Vol. 557,
460-474.
https://doi.org/10.1016/j.jhydrol.2017.11.032.
[16] Truong, P., Le, N., Hoang, T., Nguyen, T., Nguyen, T., Kieu, T.,
Nguyen, T., Izuru, S., Le, V., Raghavan, V., Nguyen, V., and Tran, T.
(2023). Climate Change Vulnerability Assessment Using GIS and Fuzzy AHP
on an Indicator-Based Approach.
International Journal of Geoinformatics
, Vol. 19(2), 39–53.
https://doi.org/10.52939/ijg.v19i2.2565.
[17] Waheed, S. Q., Alobaidy, M. N., and Grigg, N. S. (2023).
Resilience Appraisal of Water Resources System under Climate Change
Influence Using a Probabilistic-Nonstationary Approach.
Environments
, Vol. 10(5).
https://doi.org/10.3390/environments10050087.
[18] Al-Hasani, B., Abdellatif, M., Carnacina, I., Harris, C.,
Al-Quraishi, A., Maaroof, B. F. and Zubaidi, S. L., (2023). Integrated
Geospatial Approach for Adaptive Rainwater Harvesting Site Selection
under the Impact of Climate Change.
Stochastic Environmental Research and Risk Assessment
, Vol. 38(3), 1009-1033.
https://doi.org/10.1007/s00477-023-02611-0.
[19] Alwreikat, L. M. and Lananan, F., (2022). The Impact of Climate
Change and Variability on Groundwater Resources in Jordan: Literature
Review. Educational Research (IJMCER), Vol. 4(1), 272-282.
https://www.ijmcer.com/wp-content/uploads/2022/02/IJMCER_FF0410272282.pdf.
[20] El Baba, M. and Kayastha, P., (2022). Groundwater Vulnerability,
Water Quality, and Risk Assessment in a Semi-Arid Region: A Case Study
from the Dier al-Balah Governorate, Gaza Strip.
Modeling Earth Systems and Environment
, Vol. 8(3), 3957-3972.
https://doi.org/10.1007/s40808-021-01339-6.
[21] Chang, H., Jung, I. W., Strecker, A., Wise, D., Lafrenz, M.,
Shandas, V., Moradkhani, H., Yeakley, A., Pan, Y., Bean, R., Johnson,
G. and Psaris, M., (2013). Water Supply, Demand, and Quality Indicators
for Assessing the Spatial Distribution of Water Resource Vulnerability
in the Columbia River Basin. Atmosphere-Ocean, Vol. 51(4),
339-356.
http://dx.doi.org/10.1080/07055900.2013.777896.
[22] Shetty, S., Umesh, P. and Shetty, A., (2022). Dependability of
Rainfall to Topography and Micro-Climate: an Observation Using
Geographically Weighted Regression.
Theoretical and Applied Climatology
, Vol. 147(1), 217-237.
https://doi.org/10.1007/s00704-021-03811-w.
[23] RA, T. L., Sulaksana, N., CSSSA, B. Y. and Sudradjat, A., (2019).
Topographic Control on Groundwater Flow in Central of Hard Water Area,
West Progo Hills, Indonesia. Geomate Journal, Vol. 17(60),
83-89.
https://geomatejournal.com/geomate/article/view/358.
[24] World Bank, (2019).
World Development Report 2020: Trading for Development in the
Age of Global Value Chains
. The World Bank.
[25] UNICEF, (2021). Progress on Household Drinking Water,
Sanitation and Hygiene 2000–2020: Five Years into the SDGs.
World Health Organization: Geneva
, Vol. 5, 1994-2000.
[26] Jordan Water Sector Facts and Figures, (2017).
Ministry of Water & Irrigation, Jordan
. [Online], Available:
https://jordankmportal.com/resources/jordan-water-sector-facts-and-figures-1.
[27] Nikmah, F. H. and Saputra, A. J., (2023). Evaluation of the
Impact of Increasing Population Density Against Water Resources in
Coastal Areas.
LEADER: Civil Engineering and Architecture Journal
, Vol. 1(3), 211-218.
https://doi.org/10.37253/leader.v1i3.8273.
[28] Chen, Q., Mei, K., Dahlgren, R. A., Wang, T., Gong, J. and Zhang,
M., (2016). Impacts of Land Use and Population Density on Seasonal
Surface Water Quality Using a Modified Geographically Weighted
Regression. Science of the Total Environment, Vol. 572,
450-466.
https://doi.org/10.1016/j.scitotenv.2016.08.052.
[29] Jordan Water Utilities Monitoring Report, (2022).
Ministry of Water & Irrigation, Jordan
. Available:
https://www.mwi.gov.jo/EBV4.0/Root_Storage/AR/EB_Pages/Jordan_Water_Utilities_Monitoring_Report2-2022.pdf.
[30] Spiller, M., (2017). Measuring Adaptive Capacity of Urban
Wastewater Infrastructure–Change Impact and change Propagation.
Science of the Total Environment
, Vol. 601, 571-579.
https://doi.org/10.1016/j.scitotenv.2017.05.161.
[31] Abdullah, A., Sudin, S., Ahmad, Z., Saad, F., Ahmad, I., Abdullah,
F., Nik, W. M. F., Deraman A., Maliki, N. M., Kamaruzaman, S. R. S. and
Romle, S. R., (2021). Intelligent Irrigation System Using Rain Water
Harvesting System and Fuzzy Interface System.
International Journal of Nanoelectronics and Materials
, Vol. 14, 299-306.
https://ijneam.unimap.edu.my/images/PDF/InCAPE2021/Vol_14_SI_Dec_2021_299-306.pdf.
[32] Nanoelectronics Mater, Vol. 14, 299–306.
http://dspace.unimap.edu.my:80/xmlui/handle/123456789/75102.
[33] Rodríguez, C., Sánchez, R., Lozano-Parra, J., Rebolledo, N.,
Schneider, N., Serrano, J. and Leiva, E., (2020). Water Balance
Assessment in Schools and Households of Rural Areas of Coquimbo Region,
North-Central Chile: Potential for Greywater Reuse. Water,
Vol. 12(10).
https://doi.org/10.3390/w12102915.
[34] Radingoana, M. P., Dube, T. and Mazvimavi, D., (2020). An
Assessment of Irrigation Water Quality and Potential of Reusing
Greywater in Home Gardens in Water-Limited Environments.
Physics and Chemistry of the Earth
, Parts a/b/c, Vol. 116.
https://doi.org/10.1016/j.pce.2020.102857.
[35] Bino, M., Al-Beiruti, S. and Ayesh, M., (2010). Greywater use in
Rural Home Gardens in Karak, Jordan.
Greywater Use in the Middle East: Technical, Social, Economic and
Policy Issues
, S., McIlwaine, and M. Redwood, Eds. Canada: IDRC, 2010, 29-58.
[36] Al Arni, S., Elwaheidi, M., Salih, A. A., Ghernaout, D. and
Matouq, M., (2022). Greywater Reuse: An Assessment of the Jordanian
Experience in Rural Communities. Water Science and Technology,
Vol. 85(6), 1952-1963.
https://doi.org/10.2166/wst.2022.080.
[37] Loi, D., (2023). Assessment of Urban Flood Vulnerability Using
Integrated Multi-parametric AHP and GIS.
International Journal of Geoinformatics
, Vol. 19(6), 1–16.
https://doi.org/10.52939/ijg.v19i6.2689.
[38] Baghel, S., Kothari, M., Tripathi, M. P., Das, S., Kumar, A. and
Kuriqi, A., (2023). Water Conservation Appraisal Using Surface Runoff
Estimated by an Integrated SCS-CN and MCDA-AHP Technique.
Journal of Earth System Science
, Vol. 132(3).
https://doi.org/10.1007/s12040-023-02133-x.
[39] El-Mahdy, M. E. S., (2022). A Unified Index of Water Resources
Systems Vulnerability Assessment–Translating the Theoretical Approach
into a Simple Tool to Assess Climate Change Impact: Case Study in
Limpopo River Basin, Africa. Ain Shams Engineering Journal,
Vol. 13(5).
https://doi.org/10.1016/j.asej.2021.101687.
[40] Duong, H. H., Thuc, T. and Ribbe, L., (2017). Assessing and
Calculating a Climate Change Vulnerability Index for Agriculture
Production in the Red River Delta, Vietnam.
Redefining Diversity & Dynamics of Natural Resources Management
in Asia
, Vol. 2, 27–40.
https://doi.org/10.1016/B978-0-12-805453-6.00003-6.
[41] McNicoll, G., (2007). United Nations Development Programme: Human
Development Report 2006. Beyond Scarcity: Power, Poverty and The Global
Water Crisis. Popul. Dev. Rev., Vol. 33(198+).
[42] Organisation for Economic Co-operation and Development (OECD),
(2008).
Handbook on Constructing Composite Indicators. Methodology and User
Guide. Joint Research Centre-European Commission
, Paris, France.
[43] Tate, E., (2012). Social Vulnerability Indices: A Comparative
Assessment Using Uncertainty and Sensitivity Analysis.
Natural Hazards
, Vol. 63, 325-347.
https://doi.org/10.1007/s11069-012-0152-2.
[44] Nardo, M., Saisana, M., Saltelli, A. and Tarantola, S., (2005).
Tools for Composite Indicators Building.
European Commission, Ispra
, Vol. 15(1), 19-20.
[45] Hudrlíková, L. and Kramulová, J., (2013). Do Transformation
Methods Matter? The Case of Sustainability Indicators in Czech Regions.
Metodoloski Zvezki, Vol. 10(1), 31-48.
http://dx.doi.org/10.51936/sqxo6989.
[46] Kiesling, R. L., Elliott, S. M., Kennedy, J. L. and Hummel, S.
L., (2022). Validation of a Vulnerability Index of Exposure to
Chemicals of Emerging Concern in Surface Water and Sediment of Great
Lakes Tributaries of the United States.
Science of The Total Environment
, Vol. 830.
https://doi.org/10.1016/j.scitotenv.2022.154618.
[47] Aroca-Jiménez, E., Bodoque, J. M., García, J. A. and
Figueroa-García, J. E., (2022). Holistic Characterization of Flash
Flood Vulnerability: Construction and Validation of an Integrated
Multidimensional Vulnerability Index. Journal of Hydrology,
Vol. 612.
https://doi.org/10.1016/j.jhydrol.2022.128083.
[48] Plummer, R., De Grosbois, D., Armitage, D. and De Loe, R.,
(2013). An Integrative Assessment of Water Vulnerability in First
Nation Communities in Southern Ontario, Canada.
Glob. Environ. Change
, Vol. 23, 749–763.
https://doi.org/10.1016/j.gloenvcha.2013.03.005.
[49] Sullivan, C. A., (2011). Quantifying Water Vulnerability: A
Multi-Dimensional Approach.
Stochastic Environmental Research and Risk Assessment
, Vol. 25, 627-640.
https://doi.org/10.1007/s00477-010-0426-8.
[50] Wu, G., Li, L., Ahmad, S., Chen, X. and Pan, X., (2013). A
Dynamic Model for Vulnerability Assessment of Regional Water Resources
in Arid Areas: A Case Study of Bayingolin, China.
Water Resour Manage
, Vol. 27, 3085–3101.
https://doi.org/10.1007/s11269-013-0334-z.
[51] Hasan, N. A., Yang, D. and Al-Shibli, F., (2023). A
Historical–Projected Analysis in Land Use/Land Cover in Developing Arid
Region Using Spatial Differences and its Relation to the Climate.
Sustainability
, Vol. 15(3).
https://doi.org/10.3390/su15032821.
[52] Pacheco, F. A. L., Martins, L. M. O., Quininha, M., Oliveira, A.
S. and Fernandes, S. L. F., (2018). Modification to the DRASTIC
Framework to Assess Groundwater Contaminant Risk in Rural Mountainous
Catchments. J. Hydrol., Vol. 566, 175–191.
https://doi.org/10.1016/j.jhydrol.2018.09.013.
[53] Soumaila, K. I., Niandou, A. S., Naimi, M., Mohamed, C. and
Schimmel, K., (2019). Analysis of Water Resources Vulnerability
Assessment Tools.
Journal of Agricultural Science and Technology
, Vol. B9, 69-86.
https://doi.org/10.17265/2161-6264/2019.02.001.
[54] Kanga, I. S., Niandou, A. S., Naimi, M., Chikhaoui, M. and
Schimmel, K., (2019a). Analysis of Water Resources Vulnerability
Assessment Tools. JAST-B., Vol. 9, 69-86.
https://doi.org/10.17265/2161-6264/2019.02.001.