Optimal Locations of Municipal Solid Waste-to-Value-Added
Conversion Facilities Using GIS Analysis: A Case Study in
Mymensingh Division, Bangladesh
Tazin, J. E.,1 Uddin, M. N.2 and Mondal,
S.3*
Department of Electrical and Electronic Engineering, American
International University-Bangladesh (AIUB), Dhaka, Bangladesh

*Corresponding Author
Abstract
The goal of the current study was to use a GIS analysis of the
Mymensingh division to place municipal solid waste to energy
conversion facilities in the optimal location. A geographic
information system (GIS) is used to identify appropriate locations
and weed out unsuitable ones that produce a land suitability map
(LSM). The relative preferences of environmental, social, and
economic aspects are assessed using a multicriteria decision
analysis (MCDA) based on an analytical hierarchy process (AHP).
Overall, this study measures the MSW potential, examines geographic
locations for the dispersed MSW feedstock, chooses the most
suitable locations for W2VA facilities throughout the Mymensingh
division in Bangladesh, and prioritizes these locations.
Furthermore, the GIS-MCDA model provided might benefit local
governments' waste management efforts, if necessary, adjustments
were made to consider more pertinent exclusion and preference
criteria, as well as their interactions concerning tradeoffs.
Keywords: Analytic Hierarchy Process, Geographic
Information System, Land Suitability Map, Multi-Criteria Decision Analysis, Municipal Solid Waste
1. Introduction
Population expansion causes an increase in commercial, residential, and
infrastructure development, adversely affecting the environment. Among
the most difficult environmental issues facing local government in
growing economies is managing urban solid waste. Municipal Solid Waste
(MSW) is a broad term for all types of solid waste, including domestic
garbage, non-hazardous waste from businesses and institutions, and
municipal and construction debris. The main sources of MSW include
homes, businesses, hospitals, clinics, fresh markets, malls,
restaurants/canteens, and slaughterhouses [1]. About 90% of the total
MSW streams are from household solid waste (HSW), of which 80%-92% are
organic solid waste (OSW) [2]. Tourist attractions, recreation areas,
and institutions are some of the smaller sources of MSW and they
indirectly pose serious environmental and public health risks [3].
Human waste such as night soil, cremation ash, septic system sludge,
and wastewater treatment plant sludge are handled by several countries'
solid waste management systems.
In Bangladesh's cities, solid waste is produced at a rate of about 25,000
tons/day or 170 kg/capita annually. One-fourth of all urban garbage in the
nation is generated in the metropolis of Dhaka. By 2025, the overall amount
of urban solid garbage is expected to increase to 47,000 tons/day because
of population expansion and rising per capita waste production. Urban solid
trash generation averaged 0.4 kg/capita/day in 1995, but by 2025, this
number is anticipated to rise to 0.60 kg/person/day. Statistics on the
effectiveness of waste collection in various urban regions range from 37%
to 77%, with an average of 55%. A significant percentage of the waste is
not being collected, which is an unsatisfactory condition overall.
Uncollected waste contains an organic component that adversely affects the
local ecology by contaminating the land. Moreover, large amounts of solid
waste clog the drainage system after each rainfall, causing waterlogging.
Furthermore, a substantial amount of solid waste pollutes water bodies like
rivers, lakes, etc. The waste management system that is currently practiced
in Bangladesh is depicted in Figure 1.
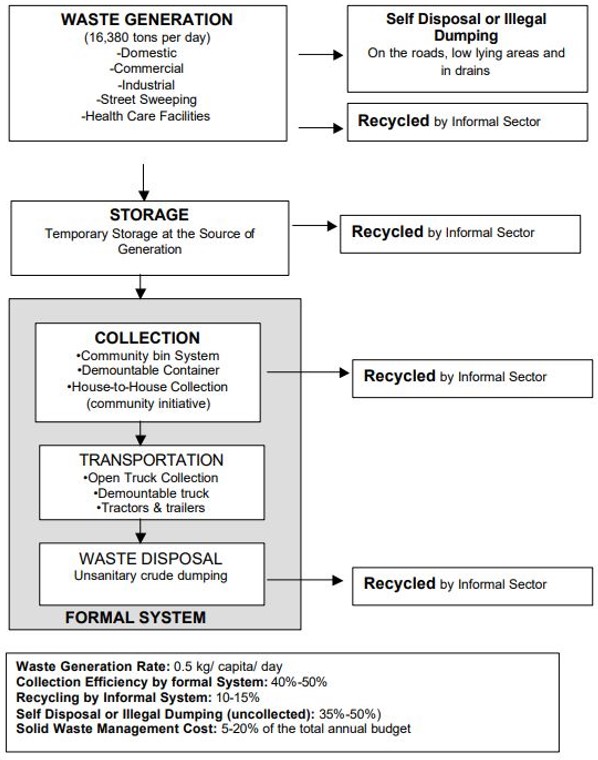
Figure 1: Solid waste management process in Bangladesh
[3]
One is the "Formal System," where solid waste management (SWM) is the
responsibility of city corporations and municipalities. The "formal
system" is based on the conventional waste collection, transportation,
and disposal procedure utilized by local governments. Recycling is not
a notion in this system. Finally, the "Informal System," which is
exemplified by the sizable informal labor force participating in the
solid waste recycling trade chain, is based on primary solid trash
collection by Community Based Organizations (CBOs) and Non-governmental
Organizations (NGOs). For the country's solid waste management system
to be effective, cooperation across all three systems is required.
Currently, Mymensingh produces around 150 tons of waste each day, of
which the municipal authority collects 130–140 tons, or about 90% of
the total, while 10–20 tons of waste are left in different city streets
and drains [4]. According to predictions made by Local Government
Engineering Department (LGED) (2017), this waste creation will double to
280 tons/day and 0.40 kg/capita/day [5].
MSW frequently ends up in Mymensingh's lowland regions with no safety
precautions or operating limitations. As a result, one of Mymensingh's
most pressing environmental concerns is MSW management. It includes the
creation, storage, collection, transportation, and processing of solid
waste [6]. The MSW management system in Mymensingh City, however, only
includes these four tasks: trash creation, collection, transportation,
and disposal [7]
Yet, despite ongoing government efforts, sustainable MSW management in
Bangladesh remains a challenge. The existing scientific literature on
the management of MSW in Bangladesh reflects this. Citizens of
Bangladesh are extremely concerned about the lack of a system for
managing urban waste that is beneficial to the environment. Together
with urbanization, higher living conditions and increasing economic
activity boosted the nation's waste production per person. Bangladesh,
the eighth-most populated nation in the world with 1,015 people per
square kilometer of land, is struggling to manage its urban trash.
However, no detailed study has been performed for the sustainable
management of MSW. Due to the lack of sufficient facilities to process
and dispose of the more significant amount of MSW generated daily in
the Mymensingh division, MSW management is currently experiencing an
unsustainable phase that pollutes the environment . The major
objectives of this study include:
-
Integrate Analytic Hierarchy Process (AHP) into the GIS system to
create a suitability map of the study area.
-
Identification of the optimal locations of waste-to-value-added
facilities conversion facilities for Mymensingh Division,
Bangladesh using a range of social, economic, and environmental
factors.
2. Materials and Methods
MSW availability is measured, potential point source locations for W2VA
conversion facilities are analyzed for suitability, and the facilities
under consideration have their spatial layouts optimized. The main
considerations in building up any W2VA conversion establishment in this
sort of study are measuring the availability of feedstock and choosing
the most suitable location for a facility by assuring compliance with
environmental, social, and economic aspects. Figure 2 illustrates the
conceptual model's flow chart as well as the multiple analyses carried
out for this study. To identify possible areas for waste conversion
facilities, an integrated GIS-AHP method was employed. A two-step
suitability study map was constructed to identify the most suitable
sites for possible conversion facilities. Areas considered
inappropriate due to social, economic, and environmental restrictions
were filtered out of the research region in the first stage, known as
an exclusion analysis. The relative preferences of the various regions
of the research area based on multi-criteria decision factors were then
discovered using a preference analysis that considered nine preference
variables. The suitability analysis map was generated by combining the
exclusion and preference analysis maps. The following sections provide a
full description of the research methodology.
2.1 Exclusion Analysis
Unsuitable locations were filtered out using an exclusion analysis
based on social, environmental, economic, hydrographic, and
geomorphological factors. The environmental limitations in this study
were predicated on regions where the construction of W2VA facilities
was restricted. The goal of limitations is to ensure that new
construction complies with current environmental and conservation
standards while avoiding interference with existing infrastructure.
Each restriction was surrounded by a buffer zone, or safety area, whose
size matched the minimum site development distance from the chosen
geographic entities. The buffer distances in this study were chosen
based on the study area's circumstances as well as recommendations from
earlier publications. The raster map for each constraint element
measures 30 m x 30 m. The image data might be transformed into a binary
image by reclassifying cells with values of "0" for the exclusion zone
and "1" for places outside of it. The final binary constraint map was
created by merging relevant data layers that could be explained by
equation 1.
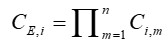
Equation 1
Where CE,i represents the Boolean value (0, 1)
assigned to the ith cell in the resultant exclusion
map; Ci,m is the Boolean cell value (0, 1) of the
ith cell value in the mth
constrained grid layer; and n shows the number of constraints
considered for the analysis. Like binary function, a value of "0" in
the final raster file indicates the cell was unsuitable for plant build
whereas a value "1" represents probable locations for building energy
facilities.
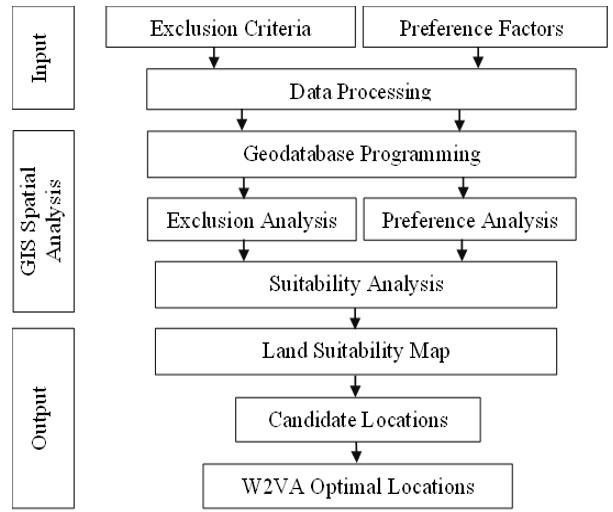
Figure 2: Flow chart for the conceptual model and
multiple analyses
2.2 Preference Analysis
To determine relative preference for specific research area regions,
preference analysis was utilized. Nine criteria based on social,
environmental, economic, and technological concerns were taken into
consideration in this study. Around each factor, many buffer rings were
created. Each buffer ring received a grade, with the most desired
location receiving a score of 10 and the least preferred receiving a
score of 1.
Then, using the respective weightages, all nine preference factor maps
were merged using the weighted overlay technique to produce a single
preference analysis map. Because the nine preference parameters are not
equally essential, the relative weightage of each was determined using
the AHP. This approach uses a relative score on a range of 1 to 9 to do
a pairwise comparison. The value of the cells on the final preference
analysis map were calculated using equation 2.
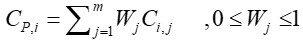
Equation 2
Where CP,i represents the grading value
of ith cell of the resultant preference map,
Ci,j mentions the grading value of
ith cell for jth preference
factor, m represents the number of preference factors considered for
this study, and Wj is the relative weightage to the jth
preference factor.
2.3 Suitability Analysis
To determine the optimal locations to build energy facilities, a
suitability study was done. The final exclusion analysis map and final
preference analysis map were integrated to generate the land
suitability map. Every map cell has a value that represents its
suitability index. To compute the suitability index, equation 3 was
utilized.
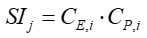
Equation 3
Where SIj represents the suitability index for the
ith
cell in the final land suitability map; CE,i defines the
Boolean value (0,1) assigned to the ith cell of the
final exclusion analysis map; CP,i represents the
ith cell value of the final preference analysis map. The land
suitability map's cell values range from 0 to 10, with 0 denoting an
unsuitable site and 10 denoting the best place to put a renewable
energy production facility. Using a reclassification tool, grading
values were applied to create buffer zones, as indicated in Table 1.
The buffer distances are referenced from previous studies, as listed in
Table 2.
3. Case Study: Mymensingh Division
3.1 Study Area characteristics
The Mymensingh Division is one of Bangladesh's eight administrative
regions. It consists of four districts-Mymensingh, Jamalpur, Sherpur,
and Netrakona (Figure 3). Currently, there are 35 sub-districts in the
Mymensingh division. As of the 2022 census, it has a population of
12,225,498 and a land area of 10,485 square kilometers (4,048 sq.mi).
The population growth rate of the Mymensingh division is 1.34% and the
population density (per square kilometer) is 1,273. The population More
than 8,000 business entities, four medical colleges, and four
universities are present. Additionally, this division has been home to
the construction of around 7,650 educational facilities, including
colleges, cadet colleges, primary schools, polytechnic institutions,
high schools, madrasas, and teacher training institutes.
Table 1: Grading values for preference factors
|
Preference level
|
Grading values
|
Road & rail
network
(km)
|
Substation & transmission lines
(km)
|
Urban areas
(km)
|
Transfer
stations
(km)
|
Slope
(degree)
|
Landcover
(type)
|
Waterbodies
(km)
|
|
Very suitable
|
9-10
|
0.05-0.1
|
0.5-1
|
> 2
|
< 30
|
< 10
|
Exposed land, low land, grassland
|
0.1-0.5
|
|
Suitable
|
7-8
|
0.1-0.5
|
1-2.5
|
5-6
|
30-70
|
10-15
|
Developed land
|
0.5-1
|
|
Almost suitable
|
5-6
|
0.5- 1.5
|
2.5-4
|
4-5
|
70-110
|
-
|
Agricultural land
|
1-1.5
|
|
Unsuitable
|
3-4
|
1.5-3
|
4-5
|
2-4
|
110-150
|
-
|
Boreal forest, mixed forest
|
1.5-2
|
|
Very unsuitable
|
1-2
|
> 3
|
> 5
|
1-2
|
150-190
|
-
|
Rock/rubble
|
> 2
|
|
Not suitable
at all
|
0
|
< 0.05
|
< 0.5
|
< 1
|
> 190
|
>15
|
Rivers, lakes, waterbodies
|
< 0.1
|
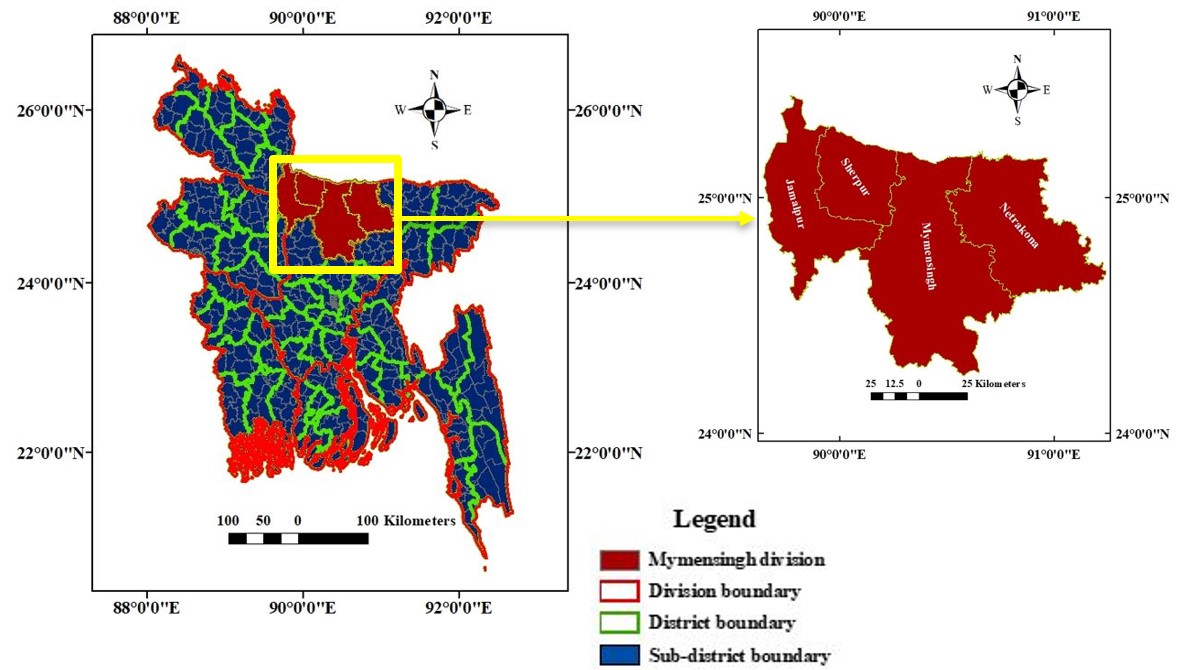
Figure 3: Study area
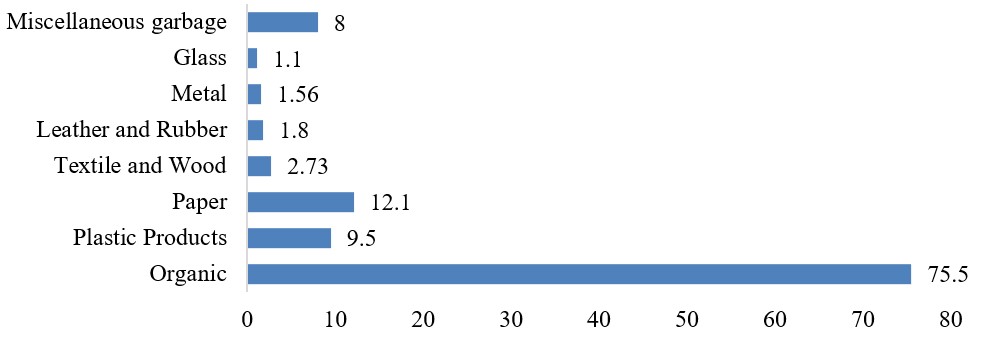
Figure 4: Composition of solid waste generated in
Mymensingh division
The main causes of Mymensingh's rising rate of solid waste creation are
urbanization and industrialization, which are coupled with population
expansion. The composition, features, and macronutrient concentrations
of municipal solid waste (MSW) were assessed through extensive field
and laboratory research carried out at the Mymensingh division. Figure
4 shows the composition of solid waste generated in the Mymensingh
division. Food/organic waste makes up a significant amount of waste
ending up at the landfill at 75.5% of total waste generated followed by
plastic waste at 9.5% and paper at 12.1%.Only a small
percentage of Mymensingh's garbage gets collected by the low-cost,
door-to-door collection system established by community-based
organizations (CBOs) and non-governmental organizations (NGOs) in the
late 1990s. A significant section of the community does not have the
opportunity to utilize garbage collection services.
3.2 Landfills
Waste materials are discarded in a landfill site, also known as a tip,
dump, rubbish dump, waste dump, or dumping ground. Lithium-based waste
disposal is now the most used method [9].
Large tracts of land or sites that have been expressly constructed and
made available for the disposal of all solid waste from municipalities
are known as landfills. 52.6 % of waste is landfilled in USA, 59.1% in
Brazil, 94.5% in Malaysia, 79% in China [10], and 42% in Bangladesh
[11] Around 37% of solid waste ends up in landfills globally [9].
3.3 Exclusion Criteria
A waste conversion plant should not be located too close to wetlands,
airports, water bodies, industrial zones, or environmentally sensitive
places for environmental reasons. For social and safety reasons, it
shouldn't be situated too close to parks, power plants, transmission
lines, gas pipelines, or other urban or rural areas. The following
parameters and accompanying distances were taken into consideration for
the constraint analysis in this study.
3.4 Preference Parameters
The preference analysis took into consideration the nine criteria listed
in Table 3.
3.4.1 Waste availability and distance from landfills
The location of a waste-to-energy conversion facility is greatly
affected by transportation costs as well as environmental issues (such
as odor and nuisance). Therefore, the locations of current landfills
play a crucial role in planning of waste conversion plants. waste
conversion facilities should be located as near as feasible to waste
collecting locations. However, transfer stations with more waste
capacity need to be prioritized over those with less waste
availability. As seen in Figure 5(a), many buffer rings were created in
this study, and grading values were given to each buffer for each
landfill with varying distances. Land near landfills should be given
consideration since reducing transportation costs is a top priority.
Maps showing grading values according to the distance from current
landfills are displayed in Table 4.
Table 2: Buffer zone areas for different exclusion
criteria
|
Criteria
|
Buffer distance [m]
|
|
Rivers and other water bodies
|
300 [6] and [7]
|
|
Remote and urban locations
|
1,000 [6] and [7]
|
|
Airports and helipad
|
8,000 [6] and [8]
|
|
Coal Field
|
1,000 [6] and [9]
|
|
Industrial areas
|
1,000 [6] and [9]
|
|
Gas and Oil field
|
1,000 [6] and [8]
|
|
Environmentally conservation areas (ECAs)
|
1,000 [6] and [8]
|
|
Natural gas and Oil pipelines
|
100 [6]
|
|
Park and outdoor activities
|
500 [6] and [8]
|
|
Roads
|
50 [7] and [10]
|
|
Power plants and substations
|
100 [6] and [11]
|
|
Electricity transmission lines
|
100 [11]
|
|
Land surface*
|
[6] and [8]
|
|
Rail Track
|
50 [11]
|
|
Coastline Ferry stations
|
1,000 [12]
|
|
Forestry
|
1,000 [6] and [8]
|
|
Aquifers
|
1,000 [6]
|
Remark: *Land having slopes larger than 15% is removed
Table 3: Preference factors
|
Sectors
|
Preference factors
|
|
Economic factors
|
Waste availability and distance from existing
landfills
|
|
Distance from substations
|
|
Distance from transmission lines
|
|
Socio-economic factor
|
Distance from roads
|
|
Distance from railways
|
|
Land slope
|
|
Environmental factor
|
Distance from waterbodies
|
Table 4: Value assigned based on distance from
landfills
|
Distance from landfills
(kilometers)
|
Grading value
|
Distance from landfills
(kilometers)
|
Grading value
|
|
0-10
|
10
|
90-110
|
5
|
|
10-30
|
9
|
110-130
|
4
|
|
30-50
|
8
|
130-150
|
3
|
|
50-70
|
7
|
150-170
|
2
|
|
70-90
|
6
|
170-190
|
1
|
3.4.2 Distance from roads
In this analysis, the existing road network is used in locating
waste-to-energy conversion facilities. Considering socio-economic
aspects regarding odor and pollution, a restricted buffer zone of 50
meters was incorporated. A facility location beyond the buffer zone
area close to the road network buffer zone area is preferable to
minimize transportation costs. Grading values were applied to several
buffer rings that were constructed around the roadways in a manner that
increased the closer the rings were to the roads. In their studies,
Sultana et al., [8] made use of the various buffer ring extents and the
road grade values. Table 1 lists the different places' grading values
according to how far away from roadways they are, and Figure 5(b)
displays the resulting map.
3.4.3 Distance from transmission lines and substations
Current transmission lines are the greatest option since transmission
prices decrease as facilities get nearer to substations. The preferred
areas' distance from substations and power lines are graded according
to the values shown in Table 1. To stick to national laws and customs,
a 500-meter buffer zone was restricted. The grading values that are
allocated to different locations according to their distance from
substations are displayed in Figure 5(c).
3.4.4 Distance from Railway
Rail networks were used to determine optimal W2VA facility sites while
incorporating a restricted buffer zone of 50 meters. For a facility to
adhere to government regulations, it must be situated outside of this
restricted area. Buffer rings were created around rail tracks based on
the distance. Table 1 shows the grading value for each buffer ring on a
scale from 0 to 10. Grading values increase as the distance from rail
tracks decreases. Figure 5(d) presents the resultant maps for rail
networks with assigned grading values.
3.4.5 Water availability
In this study, water bodies denote rivers, lakes, and other surface
water sources. Surface water pollution must be taken into consideration
and maintained by national standards, laws, and practices. Multiple
buffer zones surrounding all types of water bodies were created using
rivers and water grid data. The limited buffer zone's grading values
are displayed in Figure 5(e), where the places with the lowest
suitability were 100 meters and those with the highest suitability were
500 meters and beyond. Table 1 displays the grading values allocated
for different zones according to their respective water generates.
3.4.6 Distance from urban areas
To minimize any unexpected consequences, waste conversion plants must
be located a reasonable distance from residential areas. However,
proximity to the point of waste generation will end up in cheaper
transportation costs, which will have a substantial impact on the
plant's sustainability. Therefore, the cost of transportation is not a
direct priority but an indirect priority, considering the proximity to
residential areas [13]. Urban areas were surrounded by many buffer
rings, each of which was given a grading value that increased with the
buffer rings' distance from urban areas. The lowest distance received
the maximum grading of 10, while the greatest distance received the
lowest grade of 0. Table 1 includes these grading values and the
related distances. The grading values assigned to different places
according to their distance from urban areas are shown in Figure 5(f).
3.4.7 Slope
Since leveling slopes incurs costs, it is crucial to locate the WTE
facility in an area with a minimum slope. Sultana and Khan's research
eliminated regions from their study areas that had slopes greater than
15% [8]. Areas in this study that had slopes higher than 15% were
screened out of the study region by assigning a value of "0."
Therefore, the value of "1" was given to locations with slopes less
than 15%. The suitability of land areas according to land slopes is
depicted in Figure 5(g).
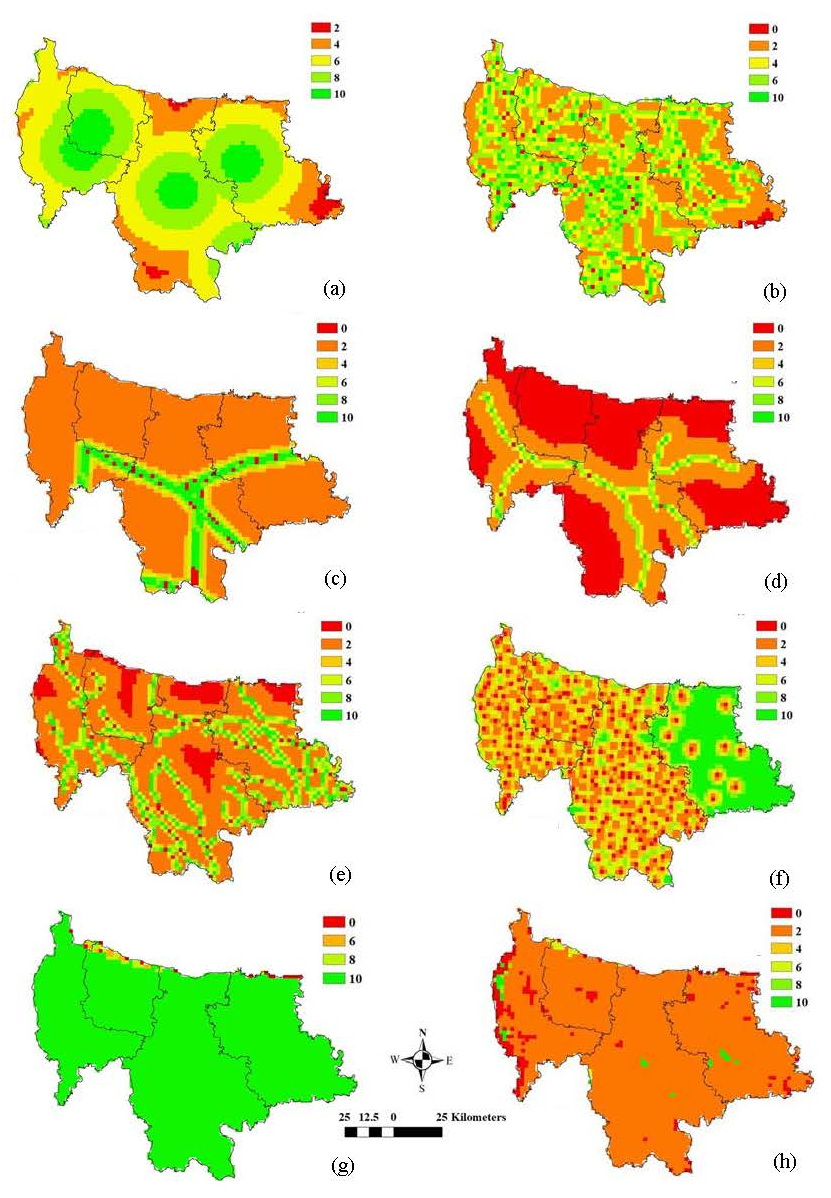
Figure 5: Grading value assigned to each factor (a)
distance from landfills, (b) distance from roads, (c) distance from transmission lines and substations, (d) distance from railways (e) distance from waterbodies, (f) distance from urban areas, (g)
slopes, (h) land cover
3.4.8 Landcover
Research by [11] was used to classify the land cover types and the
grading values. Exposed lands and grasslands are preferable as those
areas can go for planned development. Table 1 lists the grading values
for the various land cover categories. The grading values assigned to
various locations depending on land cover categories (e.g.,
agricultural land, forest areas, and grassland) are displayed in Figure
5(h).
3.5 Analytical Hierarchy Process (AHP)
After defining parameters for preference analysis and assigning grading
values accordingly, relative weightage for nine parameters was
calculated using the analytic hierarchy process (AHP). Through this
method a standardized comparison scale is used to find the relative
importance of the criteria. By pair comparison, each element is
assigned a weight from Saaty scale [14]. The fundamental scale of
relative importance is shown in Table 5. The first step is to make a
hierarchal structure of the determining factors. Secondly, based on
relative priority, rating of each pair criteria, is done by assigning a
relative weightage between "1” (equal importance) and "9” (extremely
more important). The result of the pairwise comparison on
ncriteria can be summarized in an nx
nevaluation matrix A as follows:
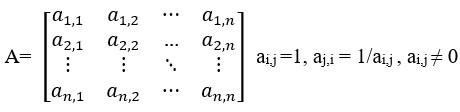
Equation 4
Whereai,j is the intensity of relative importance
between criteria i and criteria j and aj,iis the
reciprocal value of ai,j.
Then the sum of each column is calculated, and each matrix element is
divided by its corresponding column sum. Finally, pairwise comparison
value for each factor is divided by the average across each row
to calculate the relative weightage of each factor. Table 6 depicts the
pairwise comparison matrix and weights of preference factors for this
case study. The final steps of the AHP are to calculate the consistency
ratio (CR) and to check the consistency and credibility of the pairwise
comparison. The consistency ratio (CR) is calculated using the
following mathematical relation:
Equation 5
Where:
RI is the random index
CI is the consistency index
The consistency index (CI) for the matrix is calculated using
the following relation:
Equation 6
Where λmax is the maximum eigen value of the matrix
and n is the order of the matrix.
Table 7 shows the value of the RI for matrices of the order 1
to 10 using a sample size of 500 [14]. In general, consistency ratio
(CR) is lower than 0.10 verifies that the results of
comparison are acceptable [15].
Table 5: Scale of relative importance in AHP
|
Definition
|
Relative importance
|
Description
|
|
Equal importance
|
1
|
The two activities contribute equally based on
experiment and judgement
|
|
Moderately more important
|
3
|
One activity is slightly favored over another
|
|
Strongly important
|
5
|
One activity is strongly favored over another
|
|
Very strongly important
|
7
|
Experience and judgement strongly favor one
activity
|
|
Extremely important
|
9
|
The judgement favoring one activity over another
is of the highest possible order of affirmation
|
|
Intermediate values
|
2,4,6,8
|
Used when compromise is needed between two
adjacent judgments
|
|
Reciprocal values
|
If activity i has one of the above
non-zero numbers compared to activity j,
then j has the reciprocal value
|
Table 6: Pairwise comparison matrix and weights of
preference factors
|
Preference
factors
|
Waste
|
Urban
|
Water
|
Roads
|
Railway
|
Transmission
|
Substation
|
Land cover
|
Slope
|
Relative Weightage
|
|
Waste
|
1
|
3
|
5
|
7
|
7
|
8
|
9
|
9
|
9
|
0.40
|
|
Urban
|
0.33
|
1
|
2
|
3
|
4
|
4
|
4
|
5
|
6
|
0.18
|
|
Water
|
0.2
|
0.5
|
1
|
2
|
2
|
3
|
3
|
4
|
5
|
0.12
|
|
Roads
|
0.14
|
0.33
|
0.5
|
1
|
1
|
2
|
2
|
3
|
3
|
0.07
|
|
Railway
|
0.14
|
0.25
|
0.5
|
1
|
1
|
2
|
2
|
3
|
3
|
0.07
|
|
Transmission
|
0.13
|
0.25
|
0.33
|
0.5
|
0.5
|
1
|
1
|
2
|
2
|
0.05
|
|
Substation
|
0.11
|
0.25
|
0.33
|
0.5
|
0.5
|
1
|
1
|
2
|
2
|
0.04
|
|
Land cover
|
0.11
|
0.2
|
0.25
|
0.33
|
0.33
|
0.5
|
0.5
|
1
|
1
|
0.03
|
|
Slope
|
0.11
|
0.17
|
0.2
|
0.33
|
0.33
|
0.5
|
0.5
|
1
|
1
|
0.03
|
Table 7: Average random index (RI) at different matrix
sizes [14]
|
n
|
1
|
2
|
3
|
4
|
5
|
6
|
7
|
8
|
9
|
10
|
|
RI
|
0
|
0
|
0.52
|
0.89
|
1.11
|
1.25
|
1.35
|
1.4
|
1.45
|
1.49
|
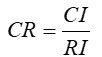
Figure 6: (a) Final exclusion analysis map, (b) Final
preference analysis map (c) Final land suitability map
Table 8: Optimum locations for the potential
conversion facilities in Mymensingh division
|
Site
|
Latitude (degree)
|
Longitude (degree)
|
Suitability Index
|
District
|
|
1
|
24.8755
|
89.9445
|
9
|
Jamalpur
|
|
2
|
24.8860
|
90.0247
|
9
|
Jamalpur
|
|
3
|
24.8139
|
90.3221
|
9
|
Mymensingh
|
|
4
|
24.7779
|
90.3220
|
9
|
Mymensingh
|
|
5
|
24.7239
|
90.3617
|
9
|
Mymensingh
|
|
6
|
24.8672
|
90.6591
|
9
|
Netrakona
|
|
7
|
24.8859
|
90.6797
|
10
|
Netrakona
|
|
8
|
24.8679
|
90.7780
|
9
|
Netrakona
|
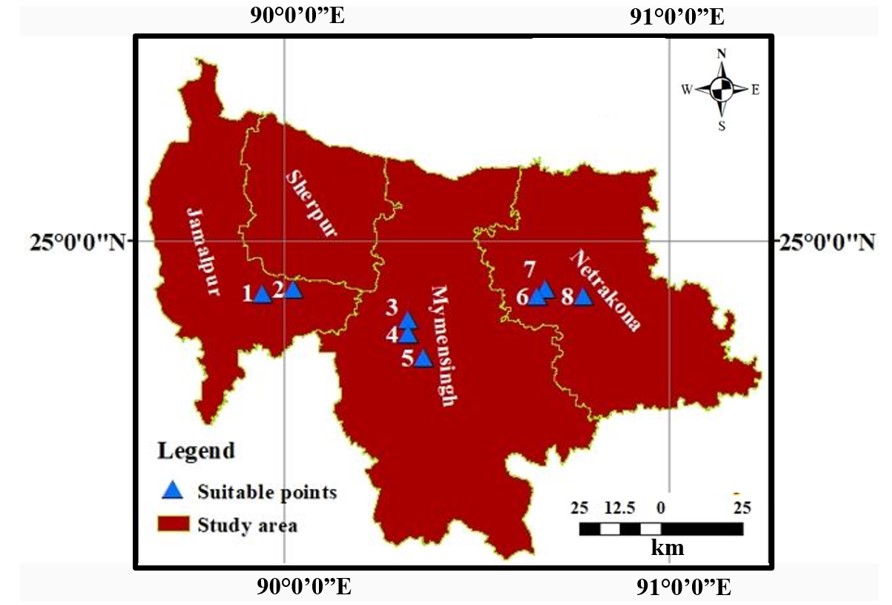
Figure 7: Optimal locations of potential conversion
facilities
4. Results and Discussion
The exclusion analysis map for the Mymensingh division appears in
Figure 6(a). In this study, the constraint analysis excluded 14.6% of
the entire study area, decreasing it to 85.4%. Forests, ecologically
vulnerable places, river bodies and industrial zones are the primary
limiting elements in exclusion analysis. For each of the nine
preference criteria listed in section 3, preference maps were developed,
then to construct the final preference map, all the preference maps
were merged using the relative weightage specified in Table 6. In the
preference study, the two main criteria influencing preference are the
proximity to the waste disposal place and the quantity of waste
available. The final site suitability map is produced by superimposing
the raster layers from the constraint and preference analysis. Figure
6(b) and Figure 6(c) show the preference and suitability analysis maps
respectively. Areas with suitability indices of 10 and 9 from the
suitability analysis were chosen for locating the conversion
facilities. Since MSW is considered as the biomass
feedstock, the suitable areas are found mostly close to the existing
landfill zones.
Research by [6] used an area of 10 hectares as a prerequisite to site a
conversion facility. Consequently, potential sites were selected based
on the centroids of polygons whose areas exceeded 10 ha. Figure 7 and
Table 8 present the eight optimal potential locations for the study
area. Depending on the higher population density, urbanization,
forests, and rivers areas, the most suitable site with suitability
index 10 (Site#7) is in Netrakona district.
5. Conclusion
The location of a new MSW conversion plant involves consideration of
environmental, social, technological, and economic factors. In this
study, AHP method based on Multi-dimensional Criteria Analysis (MCDA)
is used to calculate relative weightage for selecting and evaluating
the most suitable locations for waste-to-energy conversion facilities
in Mymensingh division, Bangladesh. The evaluation of exclusion and
preference criteria, as well as the relative weightage of chosen
preference factors, are key aspects in the suggestions for the
installation of conversion facilities as a treatment option for MSW.
To identify the optimal locations for conversion facilities, a three-step
GIS spatial analysis was conducted. First, an exclusion analysis that took
into consideration seventeen constraints resulted in the screening out of
14.6% of the area. Next, an AHP was applied to assess the relative
weightages of nine preference factors and combine these factors into a
single map. Thirdly, suitability analysis research that included the
exclusion and preference studies was carried out to determine the best
sites for waste conversion plants. The two most significant factors in the
production of waste are population density and urbanization, and if
residents of a community have a reasonable cultural understanding of waste
generation and landfilling, it will be socially, environmentally, and
economically feasible to invest more in this area. It is required to serve
these places effectively and efficiently from several perspectives,
including limiting expenses and distance travel, appropriate service time,
lowering environmental pollution, and comprehensive coverage of centers,
after finding the best locations for conversion facilities.
References
[1] Mazumder, L., Hasan, S. and Rahman, M. (2013). Hexavalent Chromium
in Tannery Solid Waste Based Poultry Feed in Bangladesh and Its Transfer to
Food Chain.
IOSR Journal of Environmental Science, Toxicology and Food Technology
(IOSR - JESTFT),
Vol. 3, 44-51.
https://doi.org/10.9790/2402-0344451.
[2] Jerin, D. T., Sara, H. H., Radia, M. A., Hema, P. S., Hasan, S.,
Urme, S. A., Audia, C., Hasan, M. T. and Quayyum, Z., (2022). An Overview of
Progress Towards Implementation of Solid Waste Management Policies in
Dhaka, Bangladesh. Heliyon,Vol. 8(2).
https://doi.org/10.1016/j.heliyon.2022.e08918.
[3] Islam, F., (2016). Solid Waste Management System in Dhaka City of
Bangladesh. Journal of Modern Science and Technology,Vol. 4(1),
192-209.
http://dx.doi.org/10.13140/RG.2.2.34881.15204.
[4] Ashikuzzaman, M. and Howlader, M. H., (2020). Sustainable Solid
Waste Management in Bangladesh: Issues and Challenges.
Sustainable Waste Management Challenges in Developing Countries, IGI
Global, Vol. 1,35-55.
http://dx.doi.org/10.4018/978-1-7998-0198-6.ch002.
[5] Khan, M. N., (2022). Assessment of Municipal Solid Waste Management
in Mymensingh City Towards Sustainable and Profitable Waste Management.
Journal of Science and Technology Research,Vol. 3, 41-48.
https://doi.org/10.3329/jscitr.v3i1.62805.
[6] Oanh, N., Thanh, P., Long, N., Chien, L., Dinh, N., Thom, T., Bich,
N., and Elshewy, M. (2024). Optimal Solid Waste Landfill Site
Identification Employing GIS-Based Multi-Criteria Decision Analysis Within
the Thach That District, Hanoi, Vietnam.
International Journal of Geoinformatics
, Vol. 20(1), 12–24.
https://doi.org/10.52939/ijg.v20i1.3021.
[7] Alsarayreh, H., and Alsarayreh, D. (2021). Assessment and
Suitability Study of Landfills in Jordan, Al-karak Using Geographic
Information Systems (GIS). International Journal of Geoinformatics, Vol. 17(3), 61–80.
https://doi.org/10.52939/ijg.v17i3.1899.
[8] Sultana, A. and Kumar, A., (2012). Optimal Siting and Size of
Bioenergy Facilities Using Geographic Information System.
Applied Energy,
Vol. 94.
https://doi.org/10.1016/j.apenergy.2012.01.052.
[9] Ma, J., Scott, N., Degloria, S. and Lembo, A., (2005). Siting
Analysis of Farm-Based Centralized Anaerobic Digester Systems for
Distributed Generation Using GIS. Biomass and Bioenergy,Vol. 28,
591-600.
https://doi.org/10.1016/j.biombioe.2004.12.003.
[10] Eskandari, M., Homaee, M. and Mahmodi, S., (2012). An Integrated
Multi Criteria Approach for Landfill Siting in a Conflicting Environmental,
Economical and Socio-Cultural Area. Waste management,Vol. 32,
1528-38.
https://doi.org/10.1016/j.wasman.2012.03.014.
[11] Islam, M. S., Sebastian, R. M., Kurian, V., Billal, M. M. and Kumar,
A., (2023). The Development of a Framework for the Selection of Optimal
Sites for the Location of Municipal Solid Waste to Value-Added Facilities
through the Integration of a Geographical Information System and a Fuzzy
Analytic Hierarchy Process. Biofuels, Bioproducts and
Biorefining,Vol. 17(6), 1622-1638.
https://doi.org/10.1002/bbb.2530.
[12] Gbanie, S. P., Tengbe, P., Momoh, J. S., Medo, J. A. and Kabba, V. T.
S., (2013). Modelling Landfill Location Using Geographic Information
Systems (GIS) and Multi-Criteria Decision Analysis (MCDA): Case Study Bo,
Southern Sierra Leone. Applied Geography,Vol. 36, 3-12.
https://doi.org/10.1016/j.apgeog.2012.06.013.
[13] Babalola, M., (2018). Application of GIS-Based Multi-Criteria
Decision Technique in Exploration of Suitable Site Options for Anaerobic
Digestion of Food and Biodegradable Waste in Oita City, Japan.
Environments
, Vol. 5.
https://doi.org/10.3390/environments5070077.
[14] Saaty, T. L., (2001). Fundamentals of the Analytic Hierarchy Process.
The Analytic Hierarchy Process in Natural Resource and Environmental
Decision Making, D. L. Schmoldt, J. Kangas, G. A. Mendoza, and M. Pesonen
Eds. Dordrecht: Springer, Netherlands, Vol. 1, 15-35.
[15] Taherdoost, H., (2017). Decision Making Using the Analytic Hierarchy
Process (AHP); A Step by Step Approach.
International Journal of Economics and Management System
. [Online], Available:
https://hal.science/hal-02557320. [Accessed Dec. 23,
2023].