Analysis of
Hotel Distribution Patterns in Hail, Saudi Arabia, Using Geographic
Information Systems (GIS)
Alshammari, B.
Department of Social Sciences, College of Arts, University of Hail,
Saudi Arabia

Abstract
Hail City has experienced several transformations and urban
advancements in the last two decades. These developments have
attracted visitors and tourists to the city and led to a
significant and urgent demand for accommodations. Local Investors
have responded to this demand by establishing numerous hotels,
albeit in a random manner. This paper aims to examine the patterns
of hotel locational distribution in Hai City, Saudi Arabia, by
utilizing Geographic Information Systems (GIS) technology. Both
Primary and secondary data were used. The primary data was
collected using the Global Positioning System (GPS) (x, y)
coordinates of each hotel within the city. Secondary data were
obtained from the tourism authorities, the city chamber, and the
municipality of Hail City. The data underwent meticulous and
rigorous processing and analysis, including several analytical
techniques such as multi-ring buffer, Kernel density, mean center,
central feature, standard distance, directional distribution, and
the average nearest neighbor analysis. This comprehensive approach
produced a reliable and accurate geospatial database of the hotels.
The study results indicate that hotels in Hail are predominantly
clustered and concentrated on the city's western and Northern sides,
demonstrating a significant agglomeration. Furthermore, the findings
revealed that the hotels are far from the Central Business District
(CBD).
Keywords: Distribution Patterns, GIS, Hotels, Saudi
Arabia, Spatial Analysis
1. Introduction
1.1 General Background
The tourism industry is a highly dynamic economic sector due to its
significant contribution to economic growth. It is achieved by
generating numerous employment opportunities, substantial funding of a
country's Gross Domestic Product, and facilitating foreign currency
inflow from goods and services offered to international visitors.
Consequently, this aids in enhancing the national income and balance of
payments. It is widely acknowledged that the hospitality industry is
crucial in driving the tourism sector across various levels. According
to the United Nations World Tourism Organization (UNWTO), 70% to 75% of
international tourists' expenditures are directed towards hospitality
services annually [1].
Tourism geography, a component of socio-economic geography, highlights
the relationship between geographical and economic space. This
relationship is particularly evident in tourism, which relies on
environmental factors. The scientific study of tourism, incorporating
geographical concepts, is classified as a distinct field, namely
tourism geography [2]. Hotels have emerged as a focal point in tourism
and geography research since the latter part of the 1980s.
Subsequently, hotels are frequently featured in scholarly investigations
for various reasons. Hotels primarily focus on tourists and are
therefore regarded as 'the most unadulterated and conspicuous
embodiments of tourism in urban areas,' as opposed to most tourist
offerings and facilities in cities that cater mainly to the local
populace.
Moreover, hotels account for a substantial portion of overall tourist
expenditures and represent a significant segment of the urban economy.
Consequently, they play a crucial role in strategies for tourism
development and urban revitalization initiatives. Their geographical
location dictates the patterns of tourist behavior and expenditures,
shaping the structure, functions, and perception of urban neighborhoods
and cities in their entirety [3].
1.2 Saudi Arabia Tourism
Tourism in Saudi Arabia has a long-standing history, dating back centuries,
positioning itself as a prominent hub for religious tourism among Muslims
worldwide owing to the presence of the two most sacred sites. Saudi Arabia
is renowned for its extensive historical legacy and diverse cultural
background, further enriched by its plentiful natural resources, all
enhanced by the stunning and awe-inspiring landscapes that travelers
frequently admire.
Additionally, Saudi Arabia is home to many significant cultural and
historical landmarks showcasing the depth of its heritage. The Kingdom
of Saudi Arabia provides many tourist attractions and activities,
presenting many opportunities for those seeking to explore its
offerings. With its varied landscapes and historical sites, Saudi
Arabia presents a compelling destination for travelers looking to
immerse themselves in a unique blend of history, culture, and natural
beauty [4][5] and [6].
The effects of the COVID-19 pandemic have severely impacted the
hospitality and tourism sector in Saudi Arabia, which is currently
recuperating. Experts anticipate that a full recovery may not be
achieved until 2024. Following the relaxation of lockdown measures and
the rise in vaccinated individuals in Saudi Arabia, there has been a
resurgence in activities such as dining out, attending events, and
visiting sports venues.
The hospitality sector, a vital pillar of the 2030 Vision plan, is set
to significantly contribute to the country's GDP, aiming for a 10%
share by 2030, a substantial increase from its current 3%. This
industry has been the fastest-growing in the region, with projections
indicating further exponential expansion in the coming years. The surge
in tourist numbers due to religious pilgrimages and hosting world-class
events in Saudi Arabia have spurred a heightened demand and swift
development in the hotel sector. Notably, Saudi Arabia is the location
for 6 out of the 11 most significant hotel projects globally. It is
estimated that the hotel market in Saudi Arabia will surpass a value of
USD 24 billion by the conclusion of 2025, with a total of 163 hotel
projects boasting 72,617 rooms scheduled to commence operations across
the kingdom, a testament to the sector's promising future [4][5][6] and
[7].
Saudi Arabia aspires to assert its dominance in the Middle East's
tourism sector and emerge as a critical player of utmost importance on
the global tourism stage. Saudi Arabia will host the 2030 World Expo
and the 2034 World FIFA Cup. The upcoming 2030 World Expo is expected
to inject a substantial economic boost into the nation's capital, with
an estimated 40 million visitors expected during the six-month
exhibition. Moreover, in a strategic move to attract
visitors, Saudi Arabia introduced a novel tourist visa tailored for
international visitors in September 2019. The realm's travel and
tourism sector plays a pivotal role in the economy by generating 1.1
million jobs, constituting 8.5% of total employment, thereby making a
substantial economic impact. Recent endeavors in the tourism domain in
Saudi Arabia have been centered around promoting various other tourism
attractions to fortify the overall tourism landscape, such as
organizing shopping extravaganzas, cultural exhibitions, recreational
pursuits, and sporting spectacles. The amalgamation of tourism and
entertainment serves as catalysts propelling the economic advancement of
Saudi Arabia [5].
In numerous nations, it is a prevalent occurrence that domestic tourism
surpasses international flows in scale and economic significance. From
a financial standpoint, stakeholders within the travel and hospitality
sector share a mutual interest in attracting more tourists who invest
their disposable income in tourism activities. The role of domestic
tourism is pivotal not only in bolstering tourism infrastructure but
also in fostering economic growth. A well-developed tourism sector is a
critical facilitator for expanding Saudi Arabia's economy, constituting
a fundamental element of Vision 2030's strategy to promote economic
diversification and diminish reliance on oil for development and
revenue generation. The essential metrics outlined in Table 1
unequivocally underscore the significance of tourism in advancing and
fortifying the Saudi economy. Projections suggest that the travel and
tourism industry's contribution to Saudi Arabia's GDP will reach
approximately 573 billion Saudi Riyals by 2028, positioning the nation
as an emerging and prominent player in the contemporary landscape of
international tourism destinations [5] and [6]. This emphasis on
economic diversification should make the audience proud of Saudi
Arabia's potential as an international tourism destination.
The exceptional geographical location of Hail City, coupled with its
vast array of tourist attractions, is crucial in drawing in visitors
and travelers, both locally and globally. In the last twenty years,
Hail City has undergone transformations and urban advancements,
including establishing a new state university, a specialized hospital,
and various tourism-related activities such as the Desert Festival, the
Summer Nights Festival, and the Hail International Rally. As a result,
there has been a surge in the influx of tourists, visitors, and
students, leading to a corresponding rise in the provision of hotels to
meet the growing demand prompted by the factors above [4] and [5]. On
the other side, hotel proprietors and stakeholders must comprehend the
significance of hotel location on market value when engaging in
purchasing, divesting, and development determinations. Likewise, hotel
evaluators and experts must grasp the impacts of location on market
value, as it is a crucial factor affecting guest satisfaction,
performance, and overall success of a hotel [7].
Table 1: Saudi Tourism Key
Indicators in 2022 and 2030
2022
|
Contribution to GDP
|
New jobs created
|
Total visitation
|
Domestic visitation
|
International visitation
|
|
5.3%
|
8,36,000
|
62 million
|
32. Million
|
29.5 million
|
2030
|
Contribution to GDP
|
New jobs created
|
Total visitation
|
Domestic visitation
|
International visitation
|
|
10%+
|
1,000,000
|
100 million
|
45 million
|
55 million
|
1.3 GIS in Tourism Research
Using spatial statistical methodologies to enhance understanding of
tourism activities has become increasingly prevalent in contemporary
times. Understanding the distribution trends of tourism supply and
demand is crucial for destination managers, investors, and other
stakeholders in the private sector. The knowledge of accommodation
locations is essential for regional planning endeavors, especially in
cases related to infrastructure service planning. On the other hand,
private investors derive valuable insights into market accessibility for
potential tourists from the spatial arrangement of hotel accommodations
and utilize this information to gauge the competitive landscape within
a specific region [8]. Given the inherent geographical information in
hotel location data, integrating Geographic Information System (GIS)
technologies in this research is paramount. This integration not only
enhances the efficiency of data management, retrieval, examination, and
representation but also has the potential to improve hotel location
determinations significantly. With the advent of the Internet and the
wealth of data available, GIS location analysis has entered a new era
of complexity and sophistication, enabling us to conduct more detailed
and nuanced investigations into spatial patterns and relationships [8].
1.4 Related Work
A notable number of studies worldwide have extensively explored the
spatial distribution patterns of hotels. The investigations are
categorized into three spatial scales: national [9][10][11][12] and
[13], regional [14][15] and [16], and international,
[17][18][19][20][21][22][23][24][25] and [26]. On the national level, a
density of hotels is observed in Taif City, Saudi Arabia, highlighting
a peak concentration on the city's western side [9]. In another
instance, [10] leveraged geographic information systems GIS and the
Nearest Neighbor Index to analyze hotel spatial distribution in
Al-Madinah, revealing a clustered distribution influenced by the
proximity to the Holy Mosque and major roads. Three additional studies
have been carried out in Jeddah City, Saudi Arabia. [11][12] and [13].
For example, [11] employed GIS to study the spatial distribution of
hotels in Jeddah, noting a rise in hotel numbers near main roads.
Similarly, [12] used Kernel density analysis and found a concentration
of hotels along the city's main roads, with a dense cluster around the
airport and the old city area. Furthermore, [13] identified the central
business district (CBD) as having the highest number of hotels, with
large-scale hotels situated further from the CBD. In contrast, smaller
hotels are concentrated within the CBD of Jeddah City.
Regionally, several investigations have been conducted in the Middle
East and North Africa region (MENA) regarding the spatial distribution
of hotels [14][15] and [16]. For instance, [14] observed notable
variations in the distribution patterns of hotels in Misrata, Libya,
with a tendency to cluster in specific geographical areas, a trend
attributed to urban expansion and access to public amenities.
Similarly, [15] scrutinized hotel distribution in the Greater Amman
area of Jordan, noting a concentration of hotels predominantly in the
city's western sector. Additionally, [16] demonstrated that in Jericho,
Palestine, hotels exhibited a clustered and irregular distribution,
primarily focusing on the city center rather than evenly spread across
the urban landscape. An early investigation conducted in Toronto,
Canada, [17] revealed a significant increase in the average size of
hotel establishments, with larger hotels gravitating towards downtown
and airport regions due to less spatial constraints. The non-random
distribution of hotels, leading to regional clustering, was a common
trend. [18] delved into the spatial analysis of hotel establishments in
Boyacá, Colombia, identifying intense clustering in five distinct
clusters associated with three city municipalities, alongside a notable
dispersion attributed to road networks and the growing appeal of
natural attractions.
In Nigeria, three studies have investigated the distribution of hotels
across various regions. [19] explored the spatial distribution of
hotels in Port Harcourt Metropolis, revealing a significant clustering
pattern with hotels concentrated in specific areas following an
east-to-west directional ellipse. [20] noted a widespread distribution
of hotels throughout Akure, with a higher concentration along the city
axis and some proximity to the central business district. Additionally,
[21] utilized GIS technology to map hotels in Lagos, highlighting the
prevalence of hotels in the Local Government Areas of Lagos state.
Studies from Europe have also delved into the spatial distribution
patterns of hotels.
For example, [22] argues that the distribution of hotel establishments
in Extremadura, Spain, follows various regional patterns. [2] utilized
kernel density estimation (KDE) of Points-of-Interest data to
illustrate the spatial distribution of different hotel types in Poland,
revealing a close association between the type of hotel and nearby
tourist attractions. [23] identified a polycentric clustering trend in
the hotel industry in Beijing, particularly within a 20 km radius of
the city center, indicating a significant spatial presence at a large
scale.
Asia has also been a focal point for research on hotel distribution
trends. For instance, [24] demonstrated an uneven distribution of chain
hotels in the central urban area of Wuhan, primarily concentrated in
specific locations. This clustering trend is characterized by hotels
near transportation hubs, commercial areas, tourist sites, and main
thoroughfares. [25] highlighted a consistent growth trajectory in
Beijing's hotel industry from 2003 to 2018, influenced by major
historical events such as the Olympic Games, leading to a shift from
centralized clustering to a more dispersed state. [26] identified
clusters of Chinese star-rated hotels, with their distribution closely
linked to local economic conditions and dependence on foreign
investment.
These studies underscore that the distribution of hotels is not
uniform or random across cities but instead is confined to specific
spatial densities at certain locations. Additionally, these studies
unanimously affirm hotels' pivotal and significant role in the travel
and tourism sector. Moreover, most literature reinforces the importance
of spatial methods and tools, particularly geographic information
systems (GIS) and other spatial statistical analyses, in understanding
hotel distribution patterns. While many studies have examined the
spatial distribution of hotels in various Saudi cities, the city of
Hail remains a gap in the literature.
Therefore, the current study tries to fill that gap by using a
Geographical information system (GIS) to investigate the spatial
distribution of hotels in Hail City. More specifically, this paper aims
to examine the distribution patterns of hotels in Hail City and (2)
investigate the geographic and economic factors influencing the spatial
distribution of hotels in Hail City. This study is expected to provide
valuable insights into the dynamic relationship between urban geography
and the tourism industry, shedding light on the spatial development
patterns in Hail. Further, this research contributes to the current
body of knowledge by examining the spatial distribution patterns of
hotels.
This study is structured as follows: Section 2 provides a detailed
research design, including information about the study area and the
data collection process. Section 3 outlines the spatial analysis
techniques used in the study. Section 4 presents and discusses the
results of the analysis. Finally, Section 5 concludes the study by
summarizing the essential findings and insights and discussing the
research objectives, outcomes, limitations, and future work. Figure 1
provides a visual representation of the study's workflow.
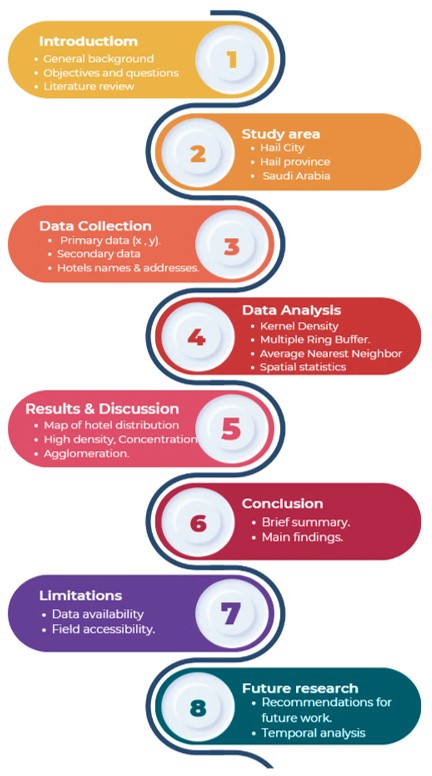
Figure 1: Study workflow
2. Research Design
2.1 The Study Area
This study was conducted in Hail, Saudi Arabia (Figure 2). Hail City, a
unique geographical entity, is home to 510,623 individuals [27].
Nestled at coordinates 27.5114° N and 41.7208° E, it is the capital of
the Hail province and spans an area of 400 km². Hail City,
strategically perched at 980 m above sea level, is a crucial point on
the Saudi Arabian map. It is located at a distance of (645) kilometers
from the Saudi capital, Riyadh, (820) kilometers from Jeddah City on
the west coast, and (1200) kilometers from Dammam on the east coast,
making it a gateway to various vital regions. The climate of Hail City
can be categorized as continental. The average annual temperature
registers at 23 °C, with summer temperatures between 35–42 °C and
winter temperatures between 5–15 °C. Precipitation levels reach around
110 mm, with two peaks occurring in March and November. Humidity levels
plummet to as low as 17% in the summer and rise to approximately 54%
during winter. The mean annual relative humidity stands at 35%.
Hail City is intricately connected to major urban centers in
neighboring Saudi regions through a network of highways. Highway 70
links the Southwest and Northeast of the region and the country, while
Highway 65 connects the Southeast and Northwest of the region and
country, and Highway 400 extends from the city center towards the east.
These three highways directly connect to the city's ring road and
central urban fabric, enhancing vehicular movement efficiency and
accessibility. Hail plays a pivotal role in the logistical framework of
the Northern Saudi Arabian Rail system (SAR), with the railway linking
the city to Riyadh in the South and to the Saudi-Jordan border in the
North (650 km). The regional railway station is approximately 20
kilometers North of the city center. The regional Hail airport
facilitates domestic and international flights. Given Hail's strategic
positioning within the Middle East, plans are to construct a new
international airport allowing one-hour flights to 11 Arab capital
cities [28] and [29].
The economic prowess of Hail City is evident in the gross domestic
product (GDP) of the Hail Region (2012), which stood at a substantial
29.6 billion riyals ($7.9bn), contributing 2.07% to the Kingdom's GDP.
The trade sector, a significant contributor to the Hail Region's
output, accounts for 26%. An investment of USD 338.66 million has been
proposed for infrastructure, accommodation, food and beverage,
entertainment, leisure, and retail sectors, further stimulating the
economic growth and potential for investment in Hail. Hail region is a
prominent agricultural center and a critical economic driver, impacting
various societal segments in the region. In 2011, the total crop area
in the region reached around 84,000 hectares, representing about 10.7%
of Saudi Arabia's total crop area, which equated to 788,000 hectares in
the same year. Hail is renowned for its UNESCO heritage sites and is
poised to become a significant hub for tourism and investment in the
foreseeable future. From 2016 to 2020, tourist trips to Hail have
steadily risen from below 500,000 to over 1,170,000. Domestic tourism
has been the primary driver of this growth, doubling in the past five
years to reach 1,160,000 tourist trips in 2020. The tourism and
manufacturing sectors play crucial roles in Hail's economy, contributing
60% to its GDP [30].
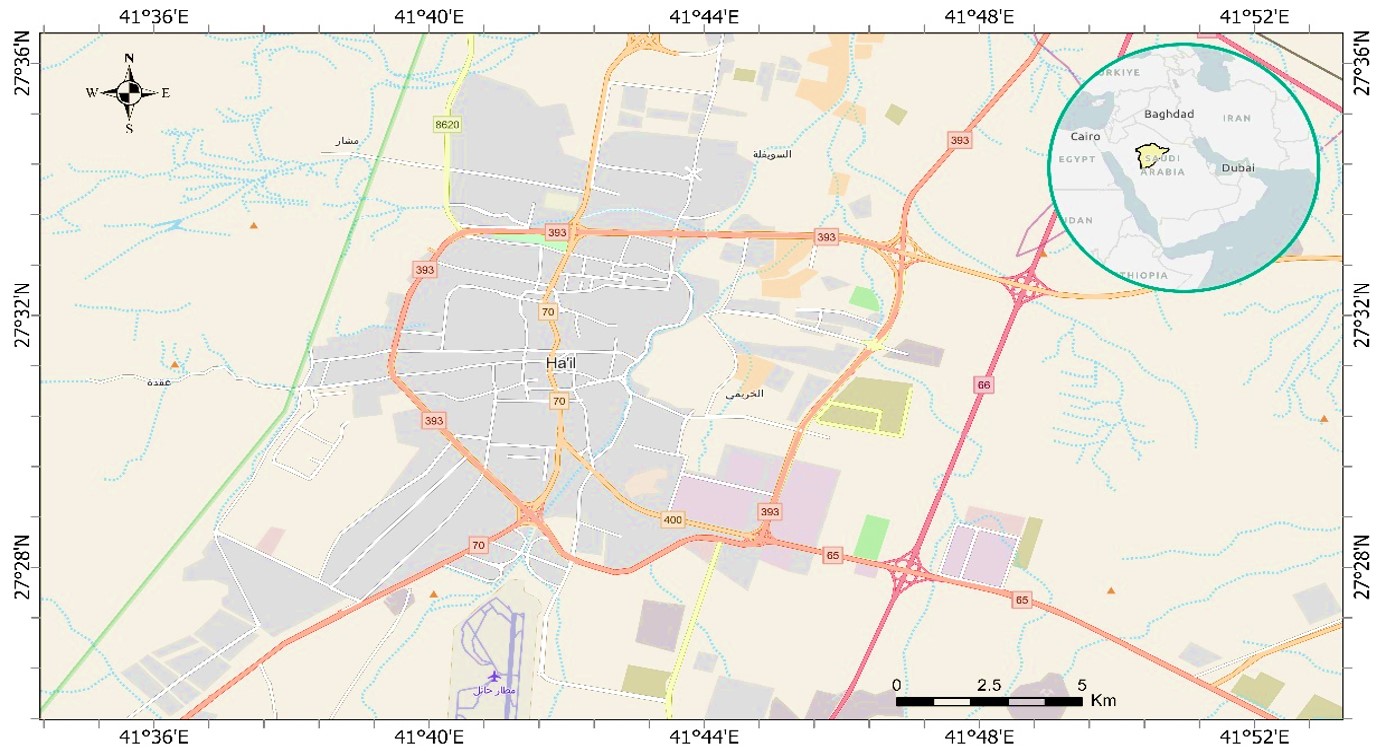
Figure 2: Location of Hail City and Hail Province,
Saudi Arabia
2.2 Data Collection
The present research relies on the data gathered as the geographical
coordinates (x, y) of 88 hotels in Hail City, Saudi Arabia, in March
2024. Then, a geographic database of all the hotels was built. In
addition, several field visits were made to ensure the existence of the
hotel locations. The database contained the hotel name, address, street,
and location. The presence of temporal data on hotels posed a
significant challenge for the research. The Ministry of Tourism, Hail
branch, disposed of outdated records about the size, location,
amenities, openings, and closures of hotels and all accommodations.
3. Spatial Analysis
Spatial pattern analysis entails recognizing, depicting, and
quantifying the form, distribution, positioning, structure, tendency,
or connections within geographical data. Geographical data become
spatial or geographic data upon being gathered with or designated by
specific locations like X and Y coordinates (longitude and latitude) or
a physical address. Once data are linked with locations, they become
mappable, and the cartographic representation of geographic data serves
as a crucial initial phase in examining spatial arrangements [31].
3.1 Kernel Density Estimation (KDE)
Kernel Density Estimation (KDE), a powerful tool in spatial analysis,
primarily aims to create a refined density surface for point events
across space. It achieves this by evaluating event intensity as a form
of density estimation, thereby revealing spatial heterogeneity or
inconsistency in the geographical process. The precision and accuracy
of KDE are ensured by using simple and kernel methods. The kernel
density technique's basic approach involves dividing an area into cells
and determining the density level surrounding each cell using the
circular neighborhood technique. This is accomplished by calculating
the ratio of the number of features concerning the area size. By
expanding the radius of the circular neighborhood, a smoother density
surface is attained, attributable to the increased coverage of points
by the circular neighborhood [2]. The Kernel formula is defined in
equation 1.
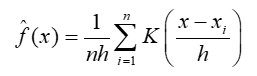
Equation 1
Where:
f̂(x) is the estimated PDF at point x.
n is the number of data points.
xi is each data point.
h is the bandwidth or smoothing parameter, which determines the width of the kernel function.
K is the kernel function.
3.2 Multi-ring Buffer Analysis
Buffer Analysis is an essential operation in GIS. It automatically
generates zones of a specified width around geometric objects such as
points, lines, or regions based on a designated buffer distance. This
operation can be applied to point, line, or region datasets to create
buffers for all objects or selected objects within the dataset.
Creating a geometric buffer for a point layer necessitates the
availability of a point layer for which the buffer will be generated
alongside an input parameter denoting the buffer width. A circular
polygon with a specified radius is generated around a point to serve as
its buffer. The buffer points for a point layer are situated at a
distance equivalent to the buffer width from the initial point. The
determination of the necessary buffer points is facilitated through the
utilization of parametric equations defining a circle. Refer to an
algorithm for generating geometric [32] and [33].
3.3 Average Nearest Neighbor Analysis
The Average Nearest Neighbor tool measures the distance between each
feature centroid and its nearest neighbor's centroid location. It then
averages all these nearest-neighbor distances to get the
nearest-neighbor index. As shown in Figure 3, if the index is less than
1, the pattern exhibits clustering. If the index is greater than 1, the
trend is toward dispersion. If the average distance is less than the
average for a hypothetical random distribution, the distribution of the
features being analyzed is considered clustered. The features are
dispersed if the average distance is more significant than a
hypothetical random distribution. The average nearest neighbor can come
up with an index of the specific concentration of data, which can be
used to compare different data with the largest concentration of data.
The average nearest neighbor method is susceptible to the Area value.
Consequently, the Average Nearest Neighbor tool is most effective for
comparing different features in a fixed study area [34]. The formula
used is defined in equation 2.
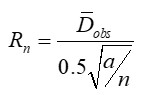
Equation 2
Where:
Rn is the nearest neighbor value.
D̄Obs is the mean observed nearest neighbor distance.
a is the area under study.
n is the total number of points [35]
3.3 Spatial Statistics Analysis
3.3.1 The mean center
The Mean Center is one of the primary metrics used to assess central
tendency. The mean center is calculated by averaging the X and Y
coordinates of all features within a dataset. Despite its simplicity,
the mean center holds significant practical implications. For instance,
epidemiologists may utilize the mean center to investigate potential
disease sources or enhance their understanding of disease transmission
mechanisms. When attribute values are incorporated as weights in the
mean center computation, the resultant location is influenced by
features with the highest attributes 29]. The Mean Center is given in
equation 3.
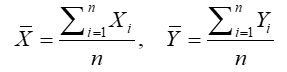
Equation 3
Where:
Xi and Yi are the
coordinates for feature i
nis the total number of features
3.4.2 The central feature
The Central Feature represents the point with the shortest distance to
all other points in the dataset, thereby identifying the most centrally
positioned feature. It proves helpful in determining the most easily
accessible feature, such as the closest hotel for hosting a meeting
with hotel managers in a specific area. By calculating the total
distance to all other features for each one, the Central Feature is
identified as the feature with the shortest total distance [35].
3.4.3 The directional distribution (Standard Deviational Ellipse)
The Directional Distribution method, an exact tool, is a common way of
measuring the trend for a set of points or areas. It calculates the
standard distance separately in the x-, y- and z-directions, defining
the axes of an ellipse (or ellipsoid) encompassing the distribution of
features. The ellipse, known as the standard deviational ellipse, is a
testament to the method's accuracy as it calculates the standard
deviation of the x-coordinates and y-coordinates from the mean center to
define the axes of the ellipse. The ellipse allows us to see if the
distribution of features is elongated and, hence, has a particular
orientation [34] and [35].
3.4.4 Standard distance
The standard distance is helpful as it provides a single summary
measure of feature distribution around their center. It functions
similarly to how a standard deviation measures the distribution of data
values around the statistical mean. The Standard Distance tool creates
a new feature class containing a circle polygon or sphere multipatch
centered on the mean for each case. Each circle polygon or sphere
multipatch is drawn with a radius equal to the standard distance. The
attribute value for each circle polygon or sphere multipatch is its
standard distance value [35]. The Standard Distance is given in
equation 4.
Equation 4
Where:
xi, yi, and zi are
the coordinates for feature i
x̄, ȳ, z̄ are the mean center for the features
n is the total number of features [31].
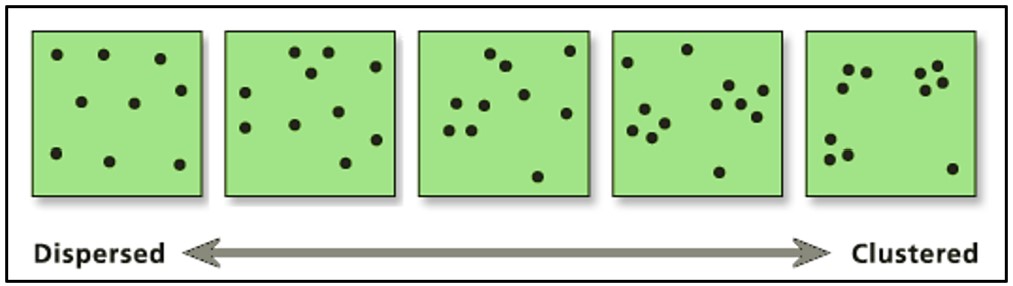
Figure 3: The output of the Average Nearest Neighbor analysis
4. Result and Discussion
4.1 Hotel Distributions
Analyzing spatial patterns involves identifying, describing, and
quantifying geographical data's form, organization, positioning,
structure, trend, or connections. Spatial or geographical data are
characterized by their association with specific locations, such as X
and Y coordinates (longitude and latitude) or an address. The initial
crucial step in spatial pattern analysis is visualizing these data
through mapping, facilitating a comprehensive examination of spatial
relationships [32]. The spatial point patterns examined in this research
pertain to the aggregate count of hotels in Hail City as of 1 April
2024, comprising 88 spatial points. Figure 4 depicts the spatial
dispersion of hotels within Hail City.
As the map shows, many hotels are situated along the city's ring road,
mainly around the western and northern sides. A predominant observation
is the positioning of hotels along the city's primary thoroughfares,
underscoring the pivotal role of accessibility in determining optimal
hotel positioning. Additionally, the map indicates the absence of
hotels on the city's east side and in the Central Business District
(CBD) due to prolonged infrastructural developments, resulting in a
paucity of hotel options. The results of hotel distribution within city
neighborhoods, as depicted in the significant data of Figures 5 and 6,
reveal that the Niqrah and Wusaitah neighborhoods hold a substantial
share of the total number of hotels. This is primarily due to the
proximity of the airport and the availability of amenities in these
areas. Notably, the city's western side demonstrates a higher level of
development than other areas.
Moreover, the density of hotels along the northern ring road,
potentially influenced by the presence of the university and
specialized hospitals, presents a unique opportunity for urban planners
and city developers. However, a more balanced distribution of hotels
could be achieved on the eastern and southern peripheries, with only
ten and fifteen establishments, respectively. This suggests a promising
potential for growth and development in these areas, especially
considering the need for more recreational, governmental, and public
amenities on the eastern and southern main roads. It is worth noting
that the only shopping centers are currently located on the northern
and western sides of the city, indicating a potential market gap in the
other areas.
4.2 Kernel Analysis of Density
Figure 7 illustrates the results of the Kernel density examination,
revealing four distinct levels of high densities and saturations within
the city. These high densities can be categorized as follows: Two areas
exhibit high density, notably along the Southwestern ring road near the
airport. The heightened concentration in these locations may be
rationalized by their proximity to the airport facilities and the city's
primary shopping center.
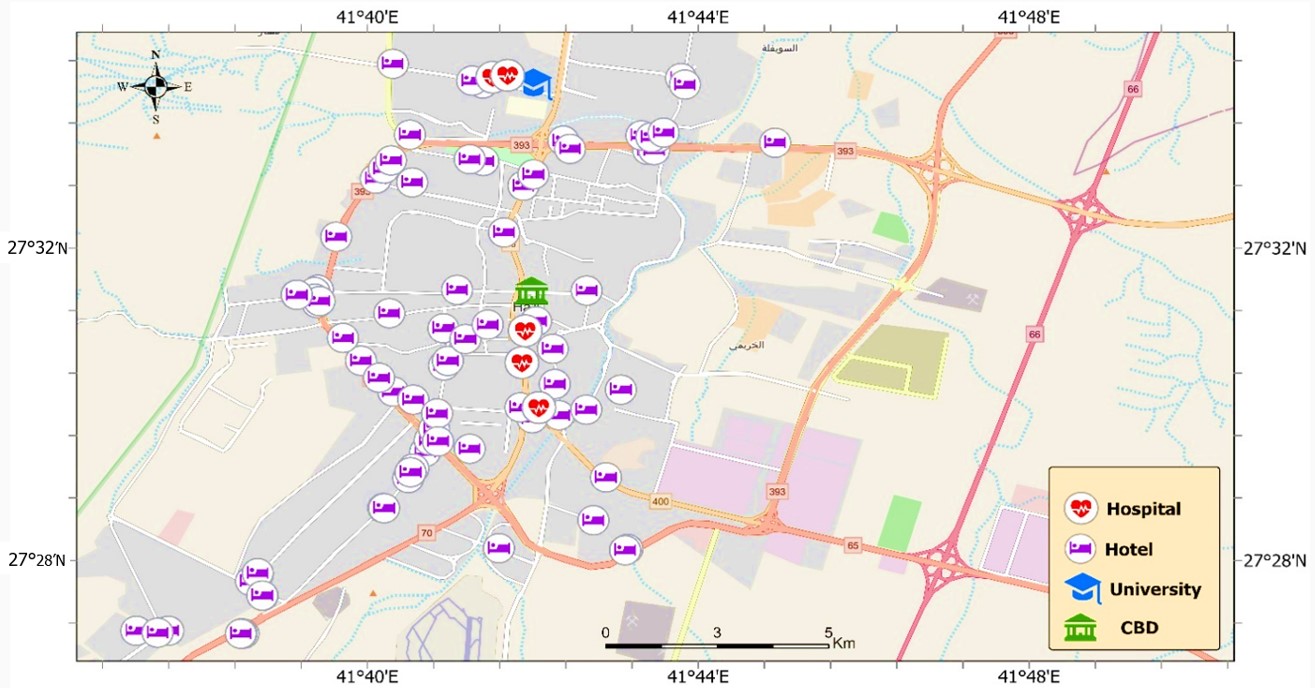
Figure 4: Map of hotel distribution
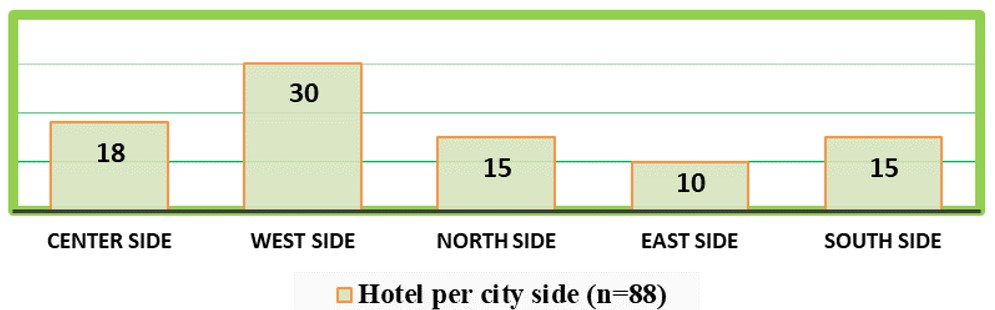
Figure 5: Distribution of hotels per city side
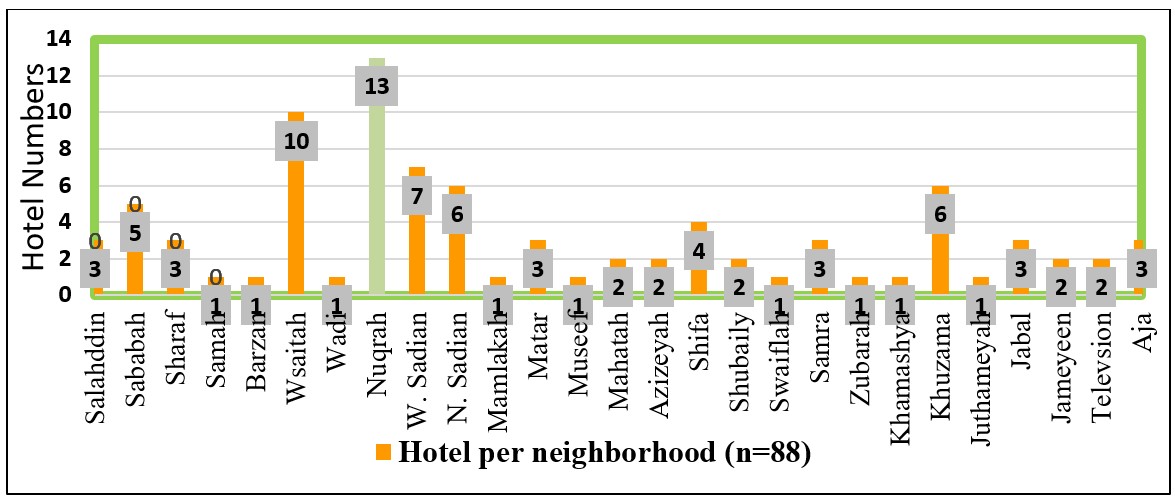
Figure 6: Distribution of Hotels per neighborhood
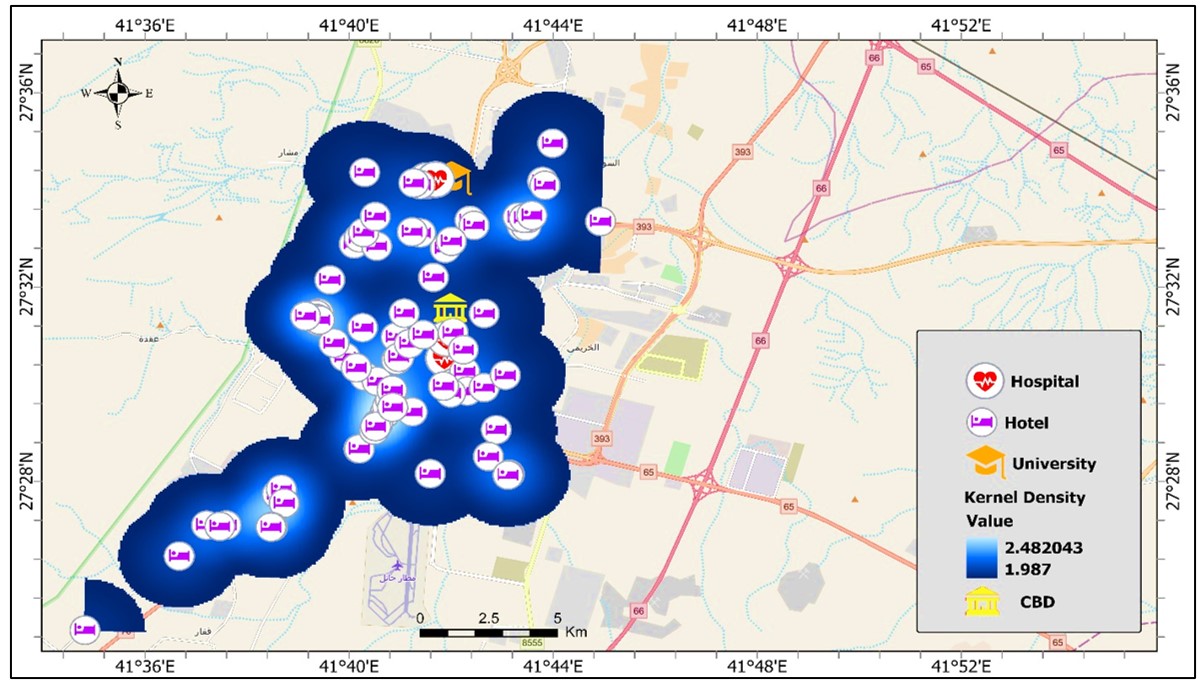
Figure 7: Results of Kernel Density Analysis
Two high densities display medium densities: one near the Mount Aja
area, renowned for its rural retreats and camping sites, and the other
along the northern ring road. There is also a large concentration of
hotels along the highway to Al-Madinah province. The sole rationale for
this spatial distribution is the proximity to the university campus and
the specialized hospital. Conversely, low densities are observed in the
remaining sides of the city, specifically in the northwest, central,
east, and southeast sides. Like any service within the tourism sector,
hotels are subject to various geographical and non-geographical
influences. These determinants include ease of access, tourist
attractions, natural landscapes, and economic provisions.
4.3 Multi-ring Buffer
Figure 8 and Table 2 show the analysis results of the Multi-ring
Buffer, which generated buffer polygons encircling the Central Business
District (CBD) up to a specified distance. Owing to the city's size, 1
kilometer is designated due to its shortness from the east to the west.
The findings reveal that each zone neighboring the CBD area encompassed
several hotels. The initial zone comprises solely one hotel, whereas
the second zone accommodates seven hotels. Details regarding the
remaining zones can be found in Table 1. Looking at the literature on
hotel location distribution, [36] introduced the Tourist-historic city
model (THC Model). The model delineates the typology of hotel locations
in medium-sized Western European towns, identifying six distinct
location zones: 1) Traditional city gates, 2) Railway station/approach
roads, 3) Main access roads, 4) Desirable locations, 5) Transition
zones and urban periphery along a motorway, and 6) airport transport
interchanges. Each of these zones is correlated with different
categories of hotels.
Comparing these results with the THC model, this model may not apply to
Hail as it does not qualify as a historic town or is situated in
Europe. Some scholars have posited that while this model is suitable
for tourist-historic cities, it may be less relevant for cities lacking
historical tourist significance [24].
Table 2: Hotels per city zone
|
Zone
|
Number of hotels
|
Zone
|
Number of hotels
|
|
First
|
1
|
Sixth
|
7
|
|
Second
|
9
|
Seventh
|
5
|
|
Third
|
13
|
Eighth
|
1
|
|
Forth
|
19
|
Ninth
|
4
|
|
Fifth
|
24
|
Other
|
5
|
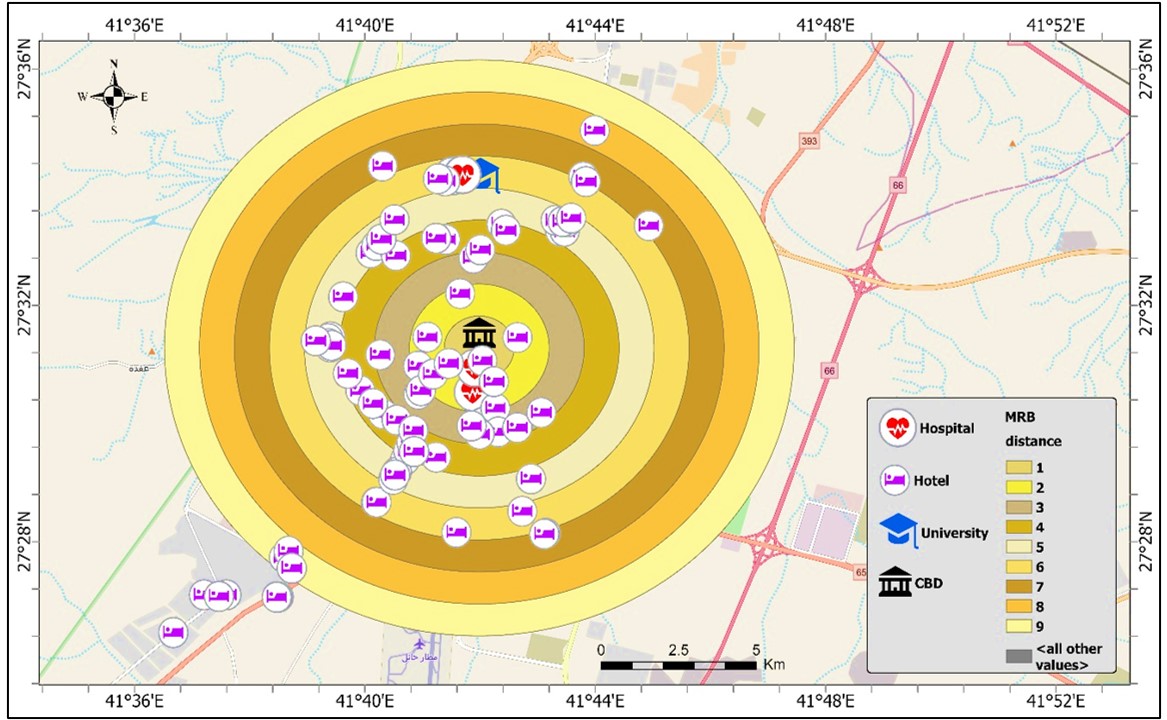
Figure 8: Results of Multiple Ring Buffer analysis of
hotels in Hail City
4.4 The Average Nearest Neighbor
Figure 9 shows the results of the Nearest Neighbor analysis, revealing
a saturation of hotels within the confines of the city, as opposed to a
random or dispersed arrangement. The findings further denote that the
mean observed distance amounts to 521.8090 meters, contrasting with the
expected mean distance of 929.1539 meters. The nearest neighbor ratio
is calculated at 0.561596, accompanied by a Z-score of z-8.088109,
indicating a probability of less than 1% for this pattern to occur by
chance. These results substantiate the preceding analyses conducted in
this research, including the Kernal density and multi-ring Buffer
analyses, showcasing a concentration in selected city areas.
4.5 Spatial Statistics Analyses
Figure 10 shows the results of the Central Tendency analysis: the mean,
the center, the Central Feature, the directional distribution, and the
standard distance. These results suggest that hotels in the city tend
to gravitate toward the southwestern side of the town. This spatial
pattern is attributed to the concentrated hotels predominantly on the
city's western side. The standard distance examination reveals a
relatively large circle size, indicating an increased dispersion of the
hotels. The limited presence of hotels on the city's outskirts may
elucidate this phenomenon.
Furthermore, the circle delineates that approximately 80% of the hotels
are within its confines. Regarding directional distribution analysis,
the findings of the Ellipses demonstrate an extension from the
northeast to the southwest, aligning with the city sprawl while
strategically avoiding the adjacent valleys and mountains. The
directional ellipse runs from North-East to Southwest. The ellipse
captured 55 out of 88 hotels. The Standard Distance Analysis captured
most hotels (68 hotels). The Mean Center and the Central Feature did
not fall in the same place because the center is obtained by averaging
the X and Y values and will fall on a new coordinate. At the same time,
the Central Feature is the feature that has the shortest distance to
all other features and will fall on the coordinates of an existing
feature.
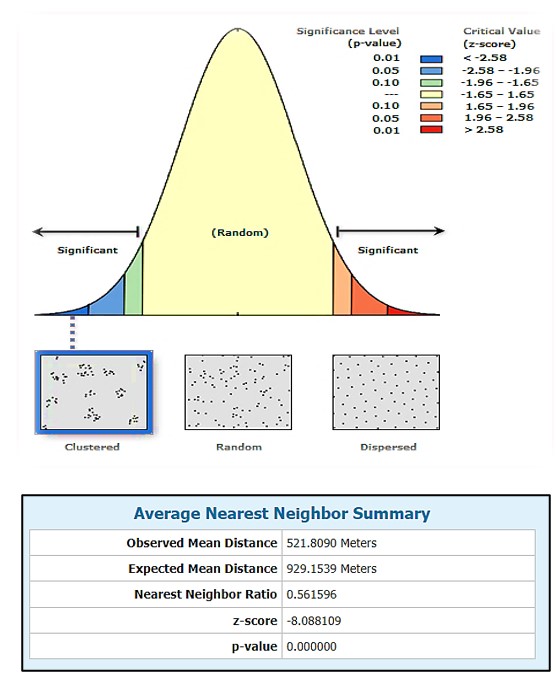
Figure 9: The results of the Average Nearest Neighbor
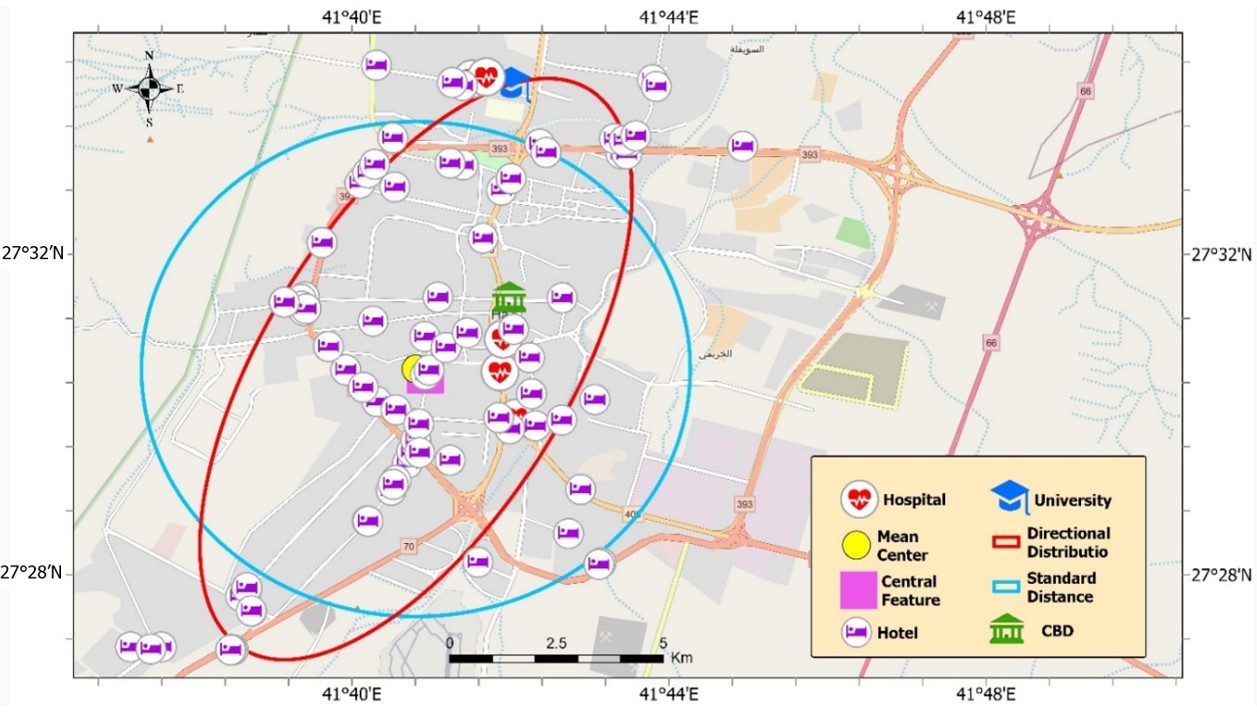
Figure 10: The results of the Mean Center, Central
Feature, distance standard, and Directional Distribution of the hotels in Hail City
5. Conclusion
This study carried out the spatial distribution of hotels in Hail City,
Saudi Arabia, and demonstrated the significance of Geographic
Information Systems (GIS) in such investigations. The increasing demand
for accommodations in Hail City resulted in a high supply without
planning. The study concludes that hotels in Hail City have various
densities, with a notable concentration around the city's west and
southwest sides and an apparent absence of hotels on the other sides.
The study found that accessibility to the central transportation hub
plays a vital role in the density of hotels. The analysis shows that
most hotels are along major roads and near the airport, supporting the
results from previous studies. Notably, two-thirds of hotels are
located in affluent neighborhoods, underscoring the economic
implications of hotel distribution. Kernel density estimation (KDE)
shows that hotels in Hail City predominantly align with business
districts, hospitals, and universities, revealing a distinct spatial
density and concentration. In contrast with several studies from the
literature, the Multi-ring Buffer shows that Hail CBD does not attract
hotels. This might be explained by congestion and poor planning in the
CBD. The study's findings align with existing literature, suggesting
that geographic factors, such as proximity to major roads and airports,
and non-geographic factors, including the economic status of the
neighborhood, significantly influence hotel distribution. Understanding
these factors can empower policymakers and urban planners to make
informed decisions about future hotel development and spatial planning,
thereby shaping the future of Hail City.
This research, the first of its kind, significantly contributes to the
literature on hotels in Hail City. Its findings hold practical
implications, particularly for stakeholders in the hotel industry.
These insights can empower decision-making regarding location and
timing by leveraging spatial patterns. For instance, hospitality
enterprises could explore growth possibilities in persistent hotspots,
especially in newly identified regions. This study has identified some
limitations. The lack of comprehensive data on hotels in Hail City,
including type, size, beds, and occupancy rate, has posed a challenge to
understanding this industry fully. Additionally, the methodology for
calculating traveler volumes between different regions has limitations.
These insights highlight the need for further research and the
potential for more accurate and comprehensive data to enhance our
understanding of hotel distribution in Hail City.
Finally, this study serves as a call to action for researchers to delve
deeper into this field, particularly the temporal evolution side. More
reliable data will be needed. The established framework and identified
factors can guide future work in this field and support stakeholders in
tourism destination management.
The high concentration and saturation of hotels in certain parts of the
city indicate a need for strategic relocation. This insight can inspire
policymakers and urban planners to balance the distribution of hotels
and promote sustainable urban development.
References
[1] Li, L., Xu. Y. and Sun, X., (2020). The Spatiotemporal Evolution
and Influencing Factors of Hotel Industry in the Metropolitan Area: An
Empirical Study Based on China. PlosOne, Vol. 15(5).
https://doi.org/10.1371/journal.pone.0231438.
[2] Bełej, M., (2021). Analysis of Spatial Distribution of Touristic
Hotels in Poland with the Kernel Density Estimation of POIs.
Cta Sci. Pol Administratio Locorum
, Vol. 20(3), 159–171.
https://doi.org/10.31648/aspal.6818.
[3] Aljoša, B., Ivan, R. and Marija, A., (2020). Evolution of Urban
Hotel Geography – A Case Study of Belgrade.
Current Issues in Tourism
, Vol. 23(6), 707-722.
https://doi.org/10.1080/13683500.2018.1530200.
[4] Rehman, A. and Alnuzhah, A., (2022). Identifying Travel Motivations
of Saudi Domestic Tourists: Case of Hail Province in Saudi Arabia.
GeoJournal of Tourism and Geosites. Vol. 43(3),1118-1128.
https://doi.org/10.30892/gtg.43333-927.
[5] Abdel Azim, T., (2017). A Triple Bottom Line Analysis of the
Impacts of the Hail International Rally in Saudi Arabia.
Managing Sport and Leisure
. Vol. 22(4), 276-309.
https://doi.org/10.1080/23750472.2018.1465841.
[6] Rehman, A. U., Abbas, M., Abbasi, F. A. and Khan, S., (2023). How
Tourist Experience Quality, Perceived Price Reasonableness, and
Regenerative Tourism Involvement Influence Tourist Satisfaction: A
Study of Ha'il Region, Saudi Arabia. Sustainability, Vol.
15(2).
https://doi.org/10.3390/su15021340.
[7] Valentin, M. and O'Neill, J. W., (2019). The Value of Location for
Urban Hotels . Cornell Hospitality Quarterly, Vol. 60(1),
5-24.
https://doi.org/10.1177/1938965518777725.
[8] Rodríguez-Rangel, M. C., Sánchez-Rivero, M. and Ramajo-Hernández,
J., (2020). Spatial Intensity in Tourism Accommodation: Modelling
Differences in Trends for Several Types through Poisson Models. ISPRS
International Journal of Geo-Information, Vol. 9(8),
https://doi.org/10.3390/ijgi9080473.
[9] Al-Shehri, A., (2020). Geographic Analysis of the Distribution of
Tourist Hotels in Al-Hada Center in Taif Governorate Using Geographic
Information Systems GIS.
Arab Journal for Scientific Publishing
, Vol. 1, 19-40.
https://gtg.webhost.uoradea.ro/PDF/GTG-3-2022/gtg.43333-927.pdf.
[10] Alomari, N., (20117). The Geographic Distribution of Hotel
Services.
Journal of Sciences and Humanities Studies. University of Benghazi
, Vol. 3(1), 1-30.
https://doi.org/10.37376/1571-000-036-010.
[11] Alharbi, S. and Aldagheiri, M., (2023). Spatial Modeling of
Evaluation of Tourist Hotel Facilities in Jeddah City Using Geographic
Information Systems.
Journal of Arabic and Islamic Sciences at Qassim University
. Vol. 1 (2), 771-840.
https://doi.org/10.1080/10095020.2016.1151205.
[12] Sabi, N., (2013).
Analysis of the Distribution Pattern of Hotels and Furnished
Apartments in the City of Jeddah
. Master's Thesis. Geography department, Umm Al-Qura University.
[13] Justinia, R., (2010). Spatial Variation of Hotels in the City of
Jeddah, A Study in the Geography of Tourism.
Journal of King Abdulaziz University, Arts and Humanities
, Vol. 18(2), 53-84.
[14] Almangoush, F., Alosta. M. and Elsawalem, A., (2022). Spatial
Analysis of the Role of Tourist Hotels in Misurata Using GIS.
Journal of Libya for Geographical Studies
. Vol. 2, 291-322.
[15] Al-Dwikat, Q., Al-Kharouf, R. and Al-Dubaisi, A., (2019). Spatial
Analysis of Classified Hotel Locations in the Greater Amman
Municipality. Yarmouk Research Journal. Vol. 25(1), 219-252.
[16] Halabi, R., (2017). Using Geographic Information Systems (GIS) to
Delineate the Most Suitable Sites for Establishing Touristic Facilities
in Jericho. Journal of Istiqlal University. Vol. 2(2),
129–154.
https://doi.org/10.36554/1796-002-001-003.
[17] Wall, G., Dudycha. D. and Hutchinson, J., (1985). Point Pattern
Analysis of Hotel in Toronto. Annals of Tourism Research, Vol.
12, 603-618.
https://doi.org/10.1016/0160-7383(85)90080-5.
[18] Parra, H., Valderrama, D. A. and Moreno, S., (2022). Analysis of
Spatial Concentration of Hotel Establishments Using Machine Learning
Techniques and Spatial Analysis Tools.
Journal of Environmental Management and Tourism
, Vol. 8(64), 2255-2262.
https://doi.org/10.14505/jemt.13.8(64).18.
[19] Kika, H. A. and Ikezam, P., (2022). Analysis of Spatial
Distribution Pattern of Hotels in Port Harcourt Metropolis, Rivers
State, Nigeria. World Journal of Advanced Research and Reviews. Vol. 15(1), 602-618.
https://doi.org/10.30574/wjarr.2022.15.1.0714.
[20] Adeyemi, B., (2013). Mapping the Locational Pattern of Hotels in
Akure, Ondo State. Journal of Humanities and Social Science.
Vol.14(3), 95-99.
http://doi.org/10.9790/1959-1439599.
[21] Omogunloye, O. G. and Ayeni O. O., (2012). Analysis of Hotels in
Lagos State with Respect to Other Spatial Data.
Research Journal in Engineering and Applied Sciences
. Vol. 1(6), 393-403.
https://doi.org/10.30574/wjarr.2022.15.1.0714.
[22] Rodríguez, R., Rivero. M. and Hernández, J., (2020). A Spatial
Analysis of Intensity in Tourism Hotel: An Application for Extremadura
(Spain). Economies. Vol. 8(28), 1-21.
https://doi.org/10.3390/economies8020028.
[23] Li, L., Lu, L., Xu, Y. and Sun, X., (2020) The Spatiotemporal
Evolution and Influencing Factors of Hotel Industry in the Metropolitan
Area: An Empirical Study Based on China. PLOS ONE. Vol.15(5).
https://doi.org/10.1371/journal.pone.0231438.
[24] Songhua, X., (2022). Study on the Spatial Distribution of Economy
Hotels in Wuhan Based on Kernel Density Estimation.
Proceedings of the 2022 3rd International Symposium on Big Data and
Artificial Intelligence
, 32–37.
https://doi.org/10.1145/3598438.3598443.
[25] Qin, J., Qin, Y., and Liu, C., (2021). Location and
Regionalization Patterns of Hotel Chains: Evidence from China.
Tourism Geographies
, Vol. 25(2-3), 729-755.
https://doi.org/10.1080/14616688.2021.1966646.
[26] Ruyi, S., Shengbao, J., Xiaozhen, W. and Fan, Li., (2016) Impacts
of Star-Rated Hotel Expansion on Inbound Tourism Development: Evidence
from China, Applied Economic, Vol. 48(32), 3033-3048.
https://doi.org/10.1080/00036846.2015.1133900.
[27] Hail Population Census Peru. General Authority of Statistics.
[Online], Available:
https://www.stats.gov.sa/en. [Accessed April. 15,
2024].
[28] Hickey, M., (2024). Spotlight: Saudi Arabia Hotel Market.
Savills.
[Online], Available:
https://www.savills.com/research_articles/255800/274275-0. [Accessed
June. 6, 2024].
[29] Rapid Growth Predicted for Saudi Hotel Sector. Gulf Daily News.
[Online], Available:
https://www.gdnonline.com/Details/471608/Rapid-growth-predicted-for-Saudi-hotel-sector.
[Accessed June. 7, 2024].
[30] Saudi Arabia to build 320,000 hotel rooms (2030). Fast Company.
[Online], Available:
https://fastcompanyme.com/news/saudi-arabia-to-build-320000-hotel-rooms-by-2030/".
[Accessed June. 4, 2024].
[31] Han, Z. and Song, W., (2020). Identification and Geographic
Distribution of Hotel and Catering Centers.
International Journal of Geo-Information
, Vol. 9.
https://doi.org/10.3390/ijgi9090546.
[32] Lauren, M. S., (2015). Spatial Pattern, Analysis of, Editor(s):
James D. Wright, International Encyclopedia of the Social &
Behavioral Sciences (Second Edition), Elsevier. 178-184.
[33] Sumeet, B., Viral, V., Deepak, C. and Venkatachalam, P., (2013).
An Algorithm for Generating Geometric Buffers for Vector Feature Layers
and geo-spatial Information. Science, Vol. 16(2), 130-138.
https://doi.org/10.1080/10095020.2012.747643.
[34] An Overview of the Measuring Geographic Distributions Toolset.
ESRI. [Online], Available:
https://pro.arcgis.com/en/proapp/latest/tool-reference/spatial-statistics/an-overvie
w-of-the-measuring-geographic-distributions toolset.htm. [Accessed June.
1, 2024].
[35] Nearest Neighbor Analysis. Barcelona Field Study Center. [Online],
Available:
https://geographyfieldwork.com/nearest_neighbour_analysis.htm..
[Accessed June. 1, 2024].
[36] Ashworth, G. J. and Tunbridge, J. E., (2000). The Tourist-Historic
City. Retrospect and Prospect of Managing the Heritage City, 1st ed.
Routledge, 2000. [Online] Available:
https://www.taylorfrancis.com/books/mono/10.4324/9780080519470/tourist-historic-city-tunbridge-ashworth.