To predict the exponential growth of the population, Equation 1 was
used [7]:
P1 = P0(1+r)n
Equation 1
Where:
P1 = Population for the target year,
P0 = current population,
r = population increment rate
n = number of expected years.
To calculate the increment rate of population in the period from 1947
to 2020, Equation 2 was used.
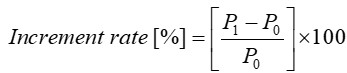
Equation 2
Where:
P1 and P0 are population for the
target year and current population, respectively.
The rapid population growth witnessed by the city, which exceeds the
number of existing residential units, has contributed to the high
occupancy density of residential units, which has led to accelerating
the urban deterioration of existing buildings, especially when not
accompanied by continuous maintenance of the buildings [10].
2.3 Distribution of the General Density of the Population in the
Quarters of Samarra
Due to the urban design pattern and its separation into quarters based
on the functions it performs, the population is dispersed unevenly
throughout the urban space. As a result, depending on its functional
qualities and the land it occupies, each type of land use draws a
different number of residents, and as a result, the densities vary
amongst the city's quarters [11]. The obvious disparity in population
densities throughout the city is a major contributor to the creation of
the phenomena of deteriorated areas inside Samarra. The number of
quarters in Samarra for the year 2015 reached 26 quarters. Table 2
displays the population number [ppl], area, and general density
[ppl/ha] per quarter in Samarra for the year 2020. Figure 3 shows the
distribution of population in the quarters of Samarra.
Figure 4 displays the various regions with different population
densities which can be divided into four regions. The following are the
general population densities at the quarter level:
First Region: It is the quarters with very high densities that
are confined between the category 425.7 ppl/ha- and 567.5 ppl/ha. It is
indicated in Figure 4 by the maroon color. These regions include Al-Bu
Naisan 567.5 ppl/ ha.
Second Region: It is the quarters with high densities that are
confined to the category 283.9-425.6 ppl/ ha. It is indicated in Figure
4 by dark brown color. These regions include Al-Bu Rahman 328.3 ppl/
ha.
Third Region: It has an average density
between 142.0-283.8 ppl/ ha and it appears in Figure 4 in light orange
color. These regions included Al-Mu’tasam 279.1 ppl/ ha, Al Hadi 240.4
ppl/ ha, Al-Mustashfa 187.5 ppl/ ha, Imam 186.7 ppl/ ha, Al-Adwia 170.8
ppl/ ha, Al-Qatool 170 ppl/ ha, Al-Mu’alimeen 167.4 ppl/ ha,
Al-Jubairia Al-Thania, 151 ppl/ ha, Al-Dhubbt 143.7 ppl/ ha, and
Al-Armooshia is 143.3 ppl/ ha,
Fourth Region: which includes low densities that are confined
to the category between 0-141.9 ppl/ ha and it is shown in Figure 4 in
pale yellow. These regions are Al-Shuhada’ 132.2 ppl/ ha, Al-Jubairia
Al-Oula 131.2 ppl/ ha, Al-Sikak 116.7 ppl/ ha, Al-Zira’a 107.2 ppl/ ha,
Al-Khadra’quarter is 80.4 ppl/ ha, and Al-Qadisia 84. ppl/ ha,
Al-Shurta 58.1 ppl/ ha, Al-Ifraz 52.6 ppl/ ha, AlJubairia Al-Thalitha
43.5 ppl/ ha, Al-Muthanna 28.6 ppl/ ha, Salahuddin 22.8 ppl/ ha, and
Al-Kafa’at 4.4 ppl/ ha. Al-Salam and Al-Yarmouk have 0 ppl/ ha since
these quarters were distributed in 2013 and are uninhabitable at
present,
This distribution tries to give a rough idea of the distribution of
densities within the city's quarters while keeping in mind that there
are spatial factors that play a role in varying densities, such as the
social and economic factor, the quarter's area, the area of residential
units, the availability of open areas, proximity and distance from the
commercial center, the availability of services, and the security
factor. There is a noticeable differential in densities at the quarter
level within the city, and there is a strong association between
density and the degree of erosion within the city since high population
densities within quarters are one of the reasons for the formation and
increase of urban erosion.
First Region: It represents a very high net density and
includes the category of 227.3 ppl/ha and 677.6 ppl/ha (maroon color).
These include the quarters (Albu Naisan, Albu Rahman, Al-Qatul,
Al-Baladiyat, and Al-Hadi). The reason for the high net density in
these quarters is due to two aspects: First: Most of these quarters have
been built randomly, so the process of its spatial organization is
complex, and the second factor is the social factor, where the
phenomenon of clan concentration is concentrated, which led to a high
population density within those areas.
Second Region: It represents a high net density and includes
the group confined between 154.8-227.2 ppl/ha (dark brown color). It is
distributed over several quarters (Al-Imam, Al-Mustasfa, Al-Mustasfa,
Al-Zira’a, Al-Sikak, Al-Mu’limeen, Al-Adwia, Al-Jubairia Al-Oula,
Al-Armooshia, Al-Armooshia, Al-Jubairia Al-Thania). The high population
density is due to the population increment in addition to another
factor which is the increase in the number of housing units due to the
division of the original housing units with large areas (600 m) into
more than one housing unit, which increased the net population density.
Third Region: It represents the average net density and
includes the category that is limited to 72.1-154.7 ppl/ha (light
orange color). It is distributed over different quarters (Al-Dhubbat,
Al-Qadisia, Al-Shuhada’, Al-Khadra’, and Al-Ifraaz).
Fourth Region: It represents the low net population density
and includes the group confined between 0-72.0 ppl/ha (pale yellow).
These include the quarters (Salahuddin, Al-Muthanna, Al-Shurta,
AlJubairia Al-Thalitha, and Al-Kafa’at). The reason for the decrease in
net population density is due to the incompleteness of Quarters as a
result of poor distribution of services or that quarters such as
Yarmouk and Al Salam are newly distributed.
3. Results and Discussion
3.1 Urban Land Use Change
Land use reflects the population's activities and their activities
inside the city. These activities are framed by insecure economic and
social relations. So, any change in the pattern of relationships is
inevitably accompanied by a change in activities and events, any change
in land uses, and this random change robs the urban individual of his
comfort and confounds the city's functions [13]. Career change in
Samarra has been influenced by two reasons, the first of which is
government activities. For the year 2002 AD, it issued Resolution 117
[14]. As a result, many green and service spaces have been converted
into residential areas, as seen in the Al-Sikak Quarter, Al-Ma'mal
Quarter, and Al-Qadisiyah District. The second driver in the
professional shift is the people within the city, particularly
following the events of 2006 AD, which saw the bombing of the Imami
shrine (peace be upon them) and the closing of the old city, causing
commercial jobs to migrate into residential neighbourhoods. It depicts
the geographical distribution of job transition areas, focusing on
commercial jobs.
3.2 The Disregard for the Law and Slum Expansions
Previous modifications and weaknesses in the country's planning laws
have contributed to a functional change in Samarra's green areas. Table
4 and Figure 6 summarize the type and direction of change. They are
divided into two sections.
-
Government abuses: Government agencies are trying to accommodate
population growth through functional changes in green spaces within
city neighborhoods. Especially for the benefit of those with strong
influence within the city, which helped change these areas, including
neighborhoods such as (Al-Zira'a, Al-Sikak, and Al-Adwia). As a result
of these exceptional allocations, the number of functional change areas
reached 11 areas, and the area of the change areas reached 4.2
hectares.
-
Encroachments and transgressions by some citizens: This results
from the poor performance of the municipality within the region, if not
its complete inability. Some citizens are converting some unused green
spaces into residential areas, especially in neighborhoods such as
(Al-Jubairiya Al-Oula, Al-Qadisiyah, Al-Armooshiya, Al-Jubairiya
Al-Thania, Salahuddin, Muthanna, Khadra, Al-Ifaraz) where the area
changed by citizens reached 8.36 hectares.
3.3 A Lack of Regard for the Law and the Growth of Slums in Urban
Areas
Due to a lack of public services such as electricity, potable water,
sewage, and waste collection. As well as the deterioration of housing
conditions and status (morphology and internal composition),
urbanisation has increased in poor, marginal slum areas within and on
cities' outskirts [15]. One of the most important factors contributing
to the emergence of slums in Samarra is the transgressor's income
level, which does not allow him to provide legal housing, so they
illegally resort to random housing.
In addition to the immigration factor, due to the deteriorating
economic conditions in the places he immigrated from. Especially in
rural areas, agriculture no longer provides economic returns,
especially for those who do not work in agriculture, as well as the
forced migration that occurred after the year 2014 AD. Also, the city
of Samarra was formed as a haven by military operations. The state of
transgression and lack of respect for the law took two forms inside the
city of Samarra:
First: Individuals and immigrants trespassing on areas
designated for incomplete public services, especially in quarters
(Al-Khadra', Al-Muthanna, Salahuddin, Al-Jubairiya Al-Thaltha, and
Al-Jubairiya Al-Oula). (Al-Khadra' - Al-Muthanna - Salah Al-Din
Al-Jubairiya Al-Thaltha - Al-Jubairiya Al-Oula). Mud, wood, and concrete
blocks are the construction materials in these quarters, which are
marked by overpopulation and a distinct lack of services.
Second: Expansion and construction in the agricultural lands
surrounding the city, where large areas of agricultural lands
surrounding the town have been sorted out randomly and distributed in
different places, especially in the north of the city as a medicine
factory, Al-Kafa'at quarter, and Al-Qadisiyah. In addition to not
taking into account the allocation of land areas for public services or
infrastructure, the number of existing housing units is estimated at
more than 600. The real problem in these areas lies when the city's
urban expansion takes place. As the city of Samarra lacks a specialised
dimension in its birth process, this generates an imbalance between its
structure and these captive spaces, which will develop degraded areas
added to the city of Samarra.
3.4 High Indicators of Service Problems
City dwellers place a high value on services, and this is due to the
growing human demand for them, particularly as the level of
urbanisation experienced by human groups has increased, as has the
development of techniques and methods used in providing and providing
the service, as well as the various and varying levels of its types in
the place [16]. Samarra suffers from a clear lack of public services in
quantity and quality. The size of the deficit is evident as follows:
-
Educational services, as the general percentage of the lack of
service within quarters is (22.1%) as the city suffers from a clear lack
of this service, in addition to taking some of these schools as
military headquarters. Also, the building is old or works in the
double-shift system, and the highest dissatisfaction rate is in the
quarters in Al-Mustashfa and Salahuddin. Also, the Al-Mustashfa
quarter, one of the slums lacking service spaces, depends on the
Al-Mu'tasim and Al-Ma'mal quarters, which are far away. Salahuddin
quarter suffers from a glaring absence of all amenities, and schools
are unavailable. While there are places allocated for educational land
uses, they are taken by random housing, forcing inhabitants to rely on
schools in the Al-Muthanna and Al-Ifraz quarters.
-
As for health services, the size of the shortage in the study
sample population amounted to 15.8%. The city has a clear deficiency in
the volume of health services, as it relies on one hospital that was
built in the 1970s to accommodate only 50 beds, putting it under a lot
of strain. In addition, the city has only three (3) health centers,
which is insufficient when compared to the number of residents,
resulting in a clear shortage. Al-Burrahman, Al-Qatul, Al-Bonaisan, and
Al-Hadi are the most famous quarters that suffer from cutting distances
to reach a medical center because the health center in the Al-Qatul
quarter was relocated to a military barracks. Because of the quarter's
modernism, the nearest health clinic is the teachers' quarter.
According to the survey, the Al-Shurta quarter suffers from the absence
of a health center nearby.
Third: Recreational services are just as vital as health and
educational services in terms of their existence, as they are a green
lung in a densely crowded metropolitan region that plays a major part
in the city's citizens' recreation. The total deficit of the study
sample reached 24%. As the lack of public parks, children's
playgrounds, and gardens is absent in the urban space, the most
prominent quarters in which the shortage rate is high are Al-Imam,
Al-Hadi, Al-Mu’tasim, Al-Sikak, Al-Mu’alimeen, Al-Adwia, Al-Dhubbat,
Al-Aramooshiya, Al-IFraz, and Al-Kafa’at. The old neighbourhoods have
grown randomly, as no places are designated for services or
entertainment. Instead, the majority is for residential purposes, as it
occupies the first place. As for the other neighborhoods’, there are
areas designated for entertainment, but they are either not exploited
by the municipality, that is, they have abandoned lands, or due to
municipal procedures, they have been converted from service areas to
residential areas. The most prominent general problems that the city
suffers from as a whole, are the following:
-
Sewage services that the city as a whole suffers from
without exception. The percentage of the deficit, according to the study
sample, reached 23.9% [16] of the total other services with their
variation in the quarters. We find that the percentage of shortages
varies between the first and second sectors, which represent the old
quarters. This is because these quarters have sewers of both types.
However, the introduction of these pipes, as well as frequent blockage
problems and poor municipal performance, are the ones that cause many
problems from the constant flooding of these quarters, especially
during the winter. Except for the Al-Mu'alimeen and Al-Armooshiya
quarters, which connect the housing units located on the main street to
the strategic conveyor line, which is currently closed due to its
incompleteness in the first place. Since 1990, these quarters have
lacked a sewage network, which is also absent in the other quarters.
This causes more suffering in the winter, especially. The new quarters
also suffer from paving the streets, which are limited only to the main
roads. The loss of sewage and street paving made the person in those
quarters feel that he lived in the early twentieth century. This was
also reflected in the groundwater problem due to sewage loss. Residents
resort to digging drains, which constitute a future demolition tool for
the housing unit.
-
Narrow streets accounted for 11.6% [17] of the overall
difficulties and were dispersed in the old quarters in the first and
second rings due to the random quarters' growth. As a result, tiny
streets exist in places such as Al-Imam, Al-Burrahman, Al-Qatul,
Al-Bunaishan, and Al-Mu'tasim. Poor planning is one of the main
causes of small streets, which are often 4 meters wide, in new or
planned quarters. The most prominent quarters that suffer from it are
Al-Jubairiya Al-Oula, Al-Dhubbat, and Al-Armooshiya.
-
Because some quarters suffer from job mixing, we find that the
old area has an old industrial quarter, which is one of the most
significant challenges it faces owing to pollution, noise, and job
dissonance in those regions. The other quarters that witness functional
overlap are Al-Jubairiya Al-Oula, Albunaisan, and Al-Zira’a, and these
industries are concentrated on the main streets. The phenomenon of
functional mixing is another issue that the city faces, as this
heterogeneous mixing presents a negative image of this interference, as
visual pollution, in addition to noise pollution, and heterogeneity in
the form of industrial stores and the exploitation of sidewalks and
streets is another type of service degradation, as well as a defect in
the city's functional structure.
-
Water and electricity services are also in limited supply,
with 19 percent [17] of the sample population experiencing an evident
shortage of potable water and 50 percent experiencing a lack of
electricity due to faulty equipment, indicating the deteriorating
condition of the city's services.
4. Conclusion
In the end, we find that the acceleration of population growth within
the city has contributed to creating a state of irregularity in urban
land use, as it is constantly changing to accommodate this population
increase. Not to mention that the movement of commercial jobs to the
new streets as a result of the security conditions witnessed by the
city played a role in the emergence of job confusion, which helped
create many problems, especially job irregularity and traffic
congestion. We also find that the population growth movement and the
inability to implement planning laws contributed to creating chaos
within the city's urban environment, represented by encroachments on
green spaces and the emergence of randomness within the urban space.
Finally, we find that the municipality's work has an important
supervisory role in regulating land uses within the city. However, the
municipality did not have that role in regulating land uses within the
urban space, contributing to the urban environment's deterioration.
5. Recommendations
-
Improve job performance within the city by balancing the
population and regulating land uses according to planning standards.
This will reduce the momentum of the city's job structure, which is
reflected in job and service performance.
-
Working on organizing the new commercial streets by modifying
and maintaining street furniture in proportion to the commercial use on
all the previous streets.
-
Tightening the municipality's oversight role, especially in
changing the purpose of use and imposing procedural restrictions on
construction work, to ensure the application of basic design vocabulary,
which achieves a high level of well-being for the urban environment
within the city.
References
[1] Hefny, R. M. and Elnasser, R. A., (2022). Impact of Population
Growth on the Most Important Economic Variables in Egypt.
Sinai Journal of Applied Sciences
, Vol 11, 765-778.
https://doi.org/10.21608/sinjas.2022.148649.1128.
[2] Hilal, M. M. and Al-Badri, M. S. M., (2021). Proposed Urban
Design of the Area Surrounding the Great Samarra Mosque.
IOP Conference Series: Earth and Environmental Science
, Vol. 779.
http://dx.doi.org/10.1088/1755-1315/1259/1/012014.
[3] O'Sullivan, J. N., (2020). The Social and Environmental
Influences of Population Growth Rate and Demographic Pressure Deserve
Greater Attention in Ecological Economics. Ecological Economics,
Vol 172.
https://doi.org/10.1016/j.ecolecon.2020.106648.
[4] Viana, J. F. D. S., Montenegro, S. M. G. L., Srinivasan, R.,
Santos, C. A. G., Mishra, M., Kalumba, A. M., and da Silva, R. M., (2023).
Land Use and Land Cover Trends and their Impact on Streamflow and Sediment
Yield in a Humid Basin of Brazil’s Atlantic Forest Biome.
Diversity
, Vol 15(12).
https://doi.org/10.3390/d15121220.
[5] Othman M. G., (2002). Planning Rural and Urban Land Uses,
1 st edition, Dar Al-Safa’, Amman, Jordan, 1-99.
[6] Debele, E. T. and Negussie, T., (2022). Socio-demographic and
Socio-Economic Dynamics Underlying Housing Development of Urban Residents in
Sebeta Town, Ethiopia. Cogent Social Sciences, Vol. 8.
https://doi.org/10.1080/23311886.2022.2130210.
[7] Najm A. A., (1989),
Changing the Population of Samarra District 1947-1987
, Master’s Thesis Submitted to the College of Education, University of
Baghdad.
[8] Central Statistical Organization, (1997). Planning Commission the
results of the Population Census of Iraq, the Section on Salah al-Din
Governorate, Samarra, 5.
[9] Ministry of Planning and Development Cooperation, (2011). Central
Statistical Organization, Salah al-Din Governorate Statistics Department,
Inventory and Numbering Data for the city of Samarra.
[10] Samarra Statistics Director, (2015). Periodic Data on the Number of
Housing Units, Unpublished Data.
[11] Muhammad S. A., (2010). Geography of Cities,
Al-Mustansiriya University, Baghdad Press, 1-223.
[12] Hussam S. A., (2014). Cartographic Analysis of Population
Distribution in Al-Amel Quarter,
University of Baghdad, Al-Ustad Magazine
, Vol. 1.
[13] Muhammad S. A., (2008). The Effect of Random Change of Land Uses on
the Basic Design of the City of Baghdad, Journal of the College of
Education, Al-Mustansiriya University, Vol. 2, 846.
[14] Samarra Municipality Directorate, (2015) Property Department,
Unpublished Data.
[15] Sabah, H. G., Riyadh, A. A. and Bashir, I. A., (2014). The Urban
Environment Problems in Iraq (Baghdad as a Model),
Sir Min Ray Magazine, Samarra University, College of Education
, Vol. 10, 139.
[16] Mazen A. A., (2013). Geography of Services, College of
Education, University of Anbar, Arab Society Library, 1 st
edition. 17.
[17] Samarra Municipality Directorate, (2017). Results of a Field Survey
of the Reality of Road Services within the City of Samarra.